Scalper1 News


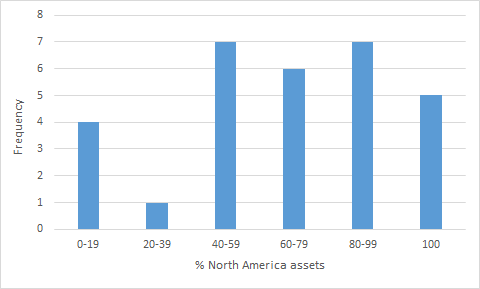
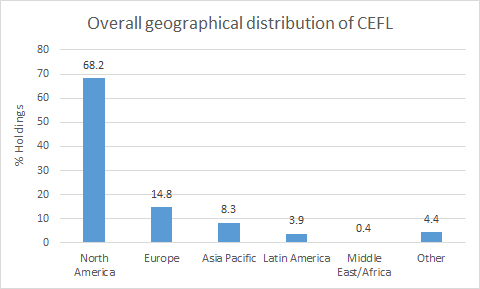
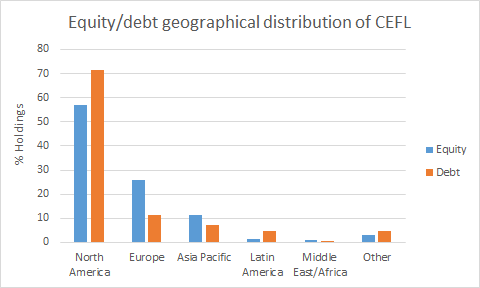
 Summary A previous article in this series investigated the leverage and expense ratio statistics of CEFL, a 2X leveraged CEF fund-of-funds. This article presents the geographical breakdown of CEFL. How much international exposure does CEFL contain? Introduction The ETRACS Monthly Pay 2xLeveraged Closed-End Fund ETN (NYSEARCA: CEFL ) is a 2x leveraged ETN offered by UBS. CEFL tracks twice the monthly return of the ISE High Income Index [YLDA], an index that is comprised of high-yielding close-ended funds [CEFs]. The methodology used to construct YLDA has been summarized here . The YieldShares High Income ETF (NYSEARCA: YYY ) tracks the same index as CEFL. While many investors are attracted solely by CEFL’s high yield (currently 20.39% ttm), I believe that it is also important to look “under the hood” of the fund and to understand its characteristics. In a previous article , we delved into the holdings of CEFL to derive relevant leverage and expense ratio statistics regarding this fund. From that analysis, we found that CEFL is approximately comprised of one-third equity and two-thirds debt, CEFL is effectively leveraged by 240%, and CEFL exhibits a total expense ratio of 4.92% per dollar invested in the fund (or 2.05% per dollar of assets controlled), after accounting for acquired fund expenses. This article seeks to present the geographical distribution of CEFL in terms of its overall holdings, or in terms of equity and debt components. Methodology The geographical distribution of the component funds was obtained from CEFConnect , Morningstar or the fund websites. As some CEFs only report their allocation by region rather than by country, it was decided to present the data in terms of region only. The five regions are North America (includes Canada), Europe (includes Russia), Asia Pacific (includes Japan and Australia), Latin American and Middle East/Africa (includes Turkey). There is also a sixth category of “other” due to the fact that some funds do not report beyond their top 10 country holdings. The funds The following table shows the fund name, ticker symbol, % assets, and % of assets in region. Fund Ticker Assets North America Europe Asia Pacific Latin America Middle East/Africa Other GAMCO GLBL GOLD NAT RES (NYSEMKT: GGN ) 4.52% 77.9 11.5 2.1 6.0 2.5 0.0 DOUBLELINE INCOME SOLUTIO (NYSE: DSL ) 4.38% 47.4 13.0 0.0 14.6 0.0 24.9 EATON VANCE TM GL DIV EQ (NYSE: EXG ) 4.28% 55.6 36.2 8.1 0.0 0.0 0.0 FIRST TRUST INTERMEDIATE (NYSE: FPF ) 4.28% 49.2 39.7 0.0 1.2 0.0 9.9 ALPINE TOTAL DYNAMIC DIVD (NYSE: AOD ) 4.27% 53.2 29.0 5.6 0.0 0.0 12.3 EATON VANCE LIMITED DURAT (NYSEMKT: EVV ) 4.26% 90.5 5.4 0.0 0.0 0.0 4.1 MFS CHARTER INCOME TRUST (NYSE: MCR ) 4.24% 67.6 11.8 2.3 0.0 0.0 18.3 CLOUGH GLBL OPPORTUNITIES (NYSEMKT: GLO ) 4.24% 88.9 3.6 12.3 0.0 0.0 -4.7 BLACKROCK CORPORATE HIGH (NYSE: HYT ) 4.20% 100.0 0.0 0.0 0.0 0.0 0.0 ALPINE GLOBAL PREMIER PRO (NYSE: AWP ) 4.19% 31.8 26.9 28.5 3.7 2.2 6.9 WESTERN ASSET EMG MKT DBT (NYSE: ESD ) 4.18% 0.0 25.4 4.5 57.3 0.0 12.8 VOYA GLBL EQTY DIVD FUND (NYSE: IGD ) 4.12% 45.8 39.3 8.7 0.0 0.0 6.2 PRUDENTIAL GL SH DUR HI Y (NYSE: GHY ) 4.11% 69.4 20.0 0.0 2.0 0.0 8.6 PIMCO DYNAMIC CREDIT INCO (NYSE: PCI ) 4.11% 76.1 6.5 12.0 5.5 0.0 0.0 BLACKROCK INTL GROWTH&INC (NYSE: BGY ) 3.91% 11.7 54.5 28.0 1.3 2.1 2.4 MORGAN STANLEY EMERGING M (NYSE: EDD ) 3.88% 0.0 33.3 23.3 43.2 26.6 0.0 EATON VANCE TAX-MGD DV EQ (NYSE: ETY ) 3.81% 92.9 6.6 0.0 0.0 0.5 0.0 ABERDEEN ASIA-PAC INCOME (NYSEMKT: FAX ) 3.43% 2.7 3.2 94.1 0.0 0.0 0.0 PRUDENTIAL SHORT DURATION (NYSE: ISD ) 3.15% 100.0 0.0 0.0 0.0 0.0 0.0 CALAMOS GLOBAL DYNAMIC IN (NASDAQ: CHW ) 3.11% 57.8 24.0 11.5 1.0 1.3 4.4 MFS MULTIMARKET INC TRUST (NYSE: MMT ) 2.84% 100.0 0.0 0.0 0.0 0.0 0.0 BLACKSTONE/GSO STRATEGIC (NYSE: BGB ) 2.65% 100.0 0.0 0.0 0.0 0.0 0.0 ALLIANZGI CONVERTIBLE & I (NYSE: NCV ) 2.42% 100.0 0.0 0.0 0.0 0.0 0.0 WESTERN ASSET HIGH INC FD (NYSE: HIX ) 2.19% 98.2 0.0 0.0 0.0 0.0 1.8 BLACKROCK MULTI-SECTR INC (NYSE: BIT ) 1.89% 84.7 12.6 1.2 0.0 0.0 1.6 WELLS FARGO ADV MULTISECT (NYSEMKT: ERC ) 1.56% 78.8 4.6 2.2 4.5 2.3 7.6 ALLIANZGI CONV & INCOME I (NYSE: NCZ ) 1.35% 84.2 15.8 0.0 0.0 0.0 0.0 WELLS FARGO ADVANTAGE INC (NYSEMKT: EAD ) 1.33% 94.9 4.4 0.1 0.0 0.0 0.6 NUVEEN PFD INC OPP FD (NYSE: JPC ) 1.12% 57.6 35.4 0.0 0.0 0.0 7.0 INVESCO DYNAMIC CREDIT OP (NYSE: VTA ) 0.96% 70.1 19.8 0.0 0.0 0.0 10.1( The following chart shows the frequency distribution of CEFs at different percentages of North American assets, the vast majority of which are U.S. assets. Geographical distribution The respective regions shown in the table above were, after accounting for the leverage of each fund, summed to determine the overall geographical distribution of CEFL. The results are presented in the graph below. We can see from the chart above that North America accounts for just over two-thirds (68.2%) of the assets of CEFL. The second-largest region is Europe, at 14.8%, followed by Asia Pacific, at 8.3%. Latin American and Middle East/Africa represent relatively minor regions at 3.9% and 0.4%, respectively. Finally, 4.4% of the assets were unaccounted for in this analysis. The next chart shows the geographical breakdown for the equity and debt components of CEFL. Recall that CEFL is comprised of approximately one-third equity and two-thirds debt. Note that for hybrid funds, I have made the assumption that the region distribution is the same for the equity and debt components of the fund. We can see from the chart above that the debt portion of CEFL contains more North American exposure (71.6%) compared to the equity portion (57.1%). On the other hand, the equity portion of CEFL contains more European exposure (25.9%) compared to the debt portion (11.4%). Discussion and conclusion This article sought to evaluate the geographical exposure of CEFL. The main conclusion from this analysis was that CEFL contained around two-thirds of North American (primarily U.S.) assets, meaning that the fund has around one-third of international exposure. What does this mean for investors? Obviously, investors who are uncomfortable with any level of international exposure should avoid CEFL, as around one-third of the fund is in foreign assets. However, other investors may be attracted to the diversification benefits offered by the international exposure of CEFL. For example, a portfolio of 70% U.S. stocks and 30% international stocks (close to the geographic allocation of CEFL) has returned 11.4% a year since 1950, which is about 2% more than S&P500, but with about 10% less risk. Additionally, I like that the North American component of CEFL contains a higher allocation to debt vs. equity than the European component of CEFL. European debt is currently low-yielding and hence expensive, with struggling countries like Spain (2.26%) and Italy (2.28%) having the same 10-year bond yields as the U.S. (2.26%), and even lower yields for Germany (0.75%) and France (1.16%). On the other hand, European stocks are a lot cheaper than U.S. stocks, with CAPE ratios of 8.6 and 16.5 for emerging and developed Europe, respectively, compared to 26.0 for the U.S. Therefore, value investors like myself would be especially pleased with CEFL’s higher allocation towards European equities compared to European debt. I hope this information will be useful for investors in or considering investing in the fund. Disclosure: I am/we are long CEFL. (More…) I wrote this article myself, and it expresses my own opinions. I am not receiving compensation for it (other than from Seeking Alpha). I have no business relationship with any company whose stock is mentioned in this article. Scalper1 News
Scalper1 News