Scalper1 News
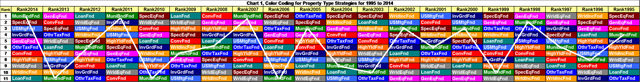
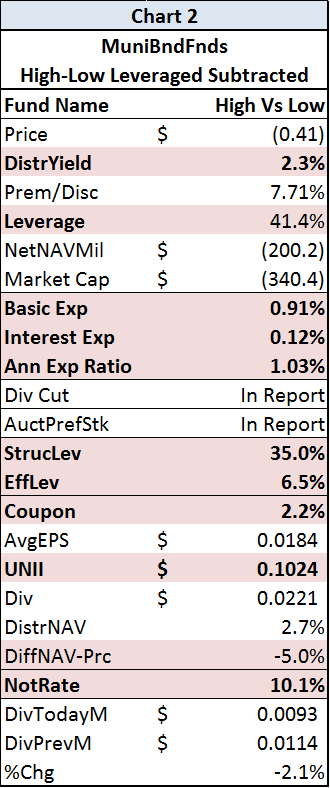
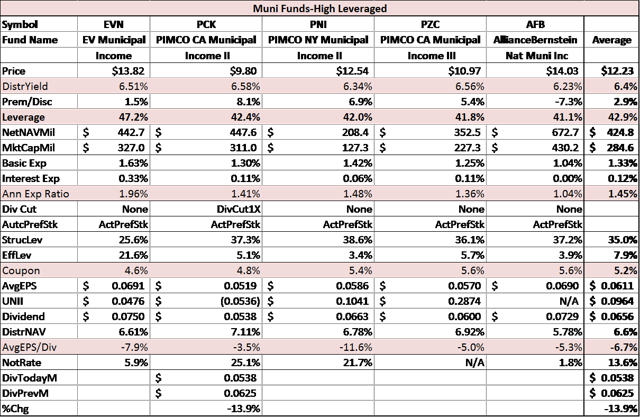
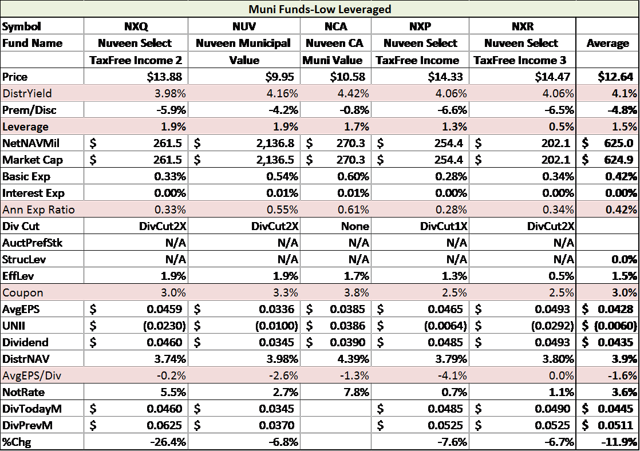
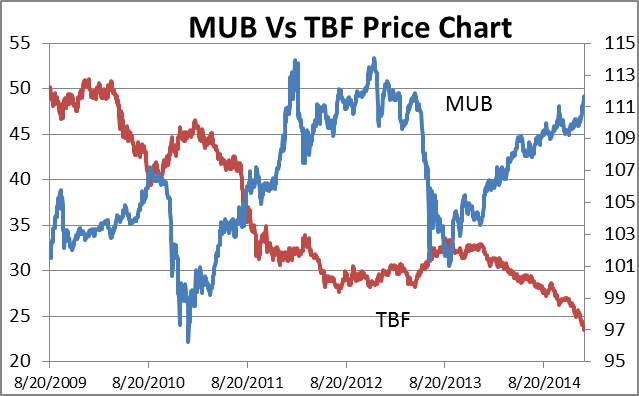 Summary CEF Muni funds from 1995 to 2014 that show in 2007 and 2011 that highest number has gone down 2 to 3 years to the lowest number. High-Leveraged and Low Leverage, what is the difference? Hedge Funds for municipal bonds. European Central Bank : Since the financial crisis in 2008, the U.S. Federal Reserve, the Bank of England (BOE), and the Bank of Japan (BOJ) have each utilized quantitative easing. Then on Thursday January 22, Mario Draghi revealed that the European Central Bank (ECB) plans to purchase over €1 trillion ($1.157 trillion) in European public and private sector bonds by the fall of 2016. This means purchasing €60 billion a month of government bonds, debt securities issued by European institutions and private sectors bonds. Though the jury is still out regarding the effectiveness of such measures, as of now it is “all over, but for the shouting”. While this policy is expected to push down European yields, rates in the U.S. will likely be moving in the other direction by year-end. So, what does all of this monetary policy mean for CEF Municipal Bond Funds? (click to enlarge) CEF Strategies from 1995 to 2014 : GrowthIncome has provided a table below plotting the annual performance for 11 Closed-End Fund sectors from 1995 to 2014. Each column is ordered from best to worst annual performance. This table also contains a line connecting the position of the MuniBndFnd (Municipal Bond Funds) sector for each year. As you see, MuniBndFnds fund types have its year-to-year rankings both above-and-below its previous year-as with all other fund types strategies As you can see in the left most column of the chart, the MuniBndFnds sector provided the best returns during 2014. MuniBndFnds were also at the top of the list in 2007 and 2011. Yet, in subsequent years (2008 and 2012), the sector plunged from number 1 to number 6, and then even further to the bottom of the pile within the next 2-3 years (2010, 2013). So, if history is any indication, it would be wise to take a closer look at MuniBndFnds after it was the best performing sector the year prior. Municipal Closed-End Funds : There are approximately 181 municipal (national and state) Closed-End funds. On average, MuniBndFnds are leveraged at 33.7%, have a 5.5% tax-free yield, a discount of -6.6%, and a 1.1% baseline fee. The market cap average is $327 million. MuniBndFnds: High & Low Leveraged: To understand this sector a bit better, GrowthIncome has put the 5 highest leveraged funds and the 5 lowest leveraged funds into 2 separate groups: 5 High-Leveraged and 5 Low-Leveraged . Chart 2 contains the results of subtracting the averages of the 5 Low-Leveraged group from the 5 High-Leveraged group. Specifics for each fund and the averages for each group can be found in charts towards the end of the report Subtracting 5 Low-Leveraged from 5 High-Leveraged : Subtracting the averages of the 5 Low-Leveraged group from the 5 High-Leveraged group results in a distribution yield of 2.3% (High: 6.4% – Low: 4.1%) and a leverage of 41.4% (structural leverage: 35.0% and effective leverage: 6.4%). A few other metrics of note are Basic Expense, Interest Expense, and Annual Expense Ratio which come in at 0.91%, 0.12% and 1.03%, respectively. It seems 5 High-Leveraged funds have a portfolios coupon advantage. The coupon between 5 High-Leveraged versus 5 Low-Leveraged is 2.2% (High: 5.2% – Low: 3.0%). This is most likely a result of the 5 High-Leveraged group placing 13.6% of their portfolios in “unrated” municipal bonds while the 5 Low-Leverage group placing only 3.5% (a subtraction of 10.0%). UNII : The Undistributed Net Investment Income (UNII) of the High-Leveraged group is $0.0964 minus the UNII of the Low-Leverage group of $-0.006 results in a UNII of $0.1024 per share. So, the High-Leveraged MuniBndFnds have much more UNII than the Low-Leveraged funds. Dividend Cuts : Of the 5 High-Leveraged funds, only 1 cut their distribution in 2014: PIMCO CA Municipal Income II (NYSE: PCK ) . The 2014 monthly dividend rate dropped from $.0625 to $0.538, a 13.9% decline, in May. However on the Low-Leveraged side, 4 of the 5 funds cut distributions in 2014. The only fund that didn’t was Nuveen CA Muni Value (NYSE: NCA ). Nuveen Select Tax-Fee Income (NYSE: NXP ) cut it monthly distribution in 2014 once by 7.6%. Three (3) funds cut their distributions 2 times in 2014. This was Nuveen Select Tax-Free Income 2 (NYSE: NXQ ) by 12.4%, Nuveen Municipal Value (NYSE: NUV ) by 6.8% and Nuveen Select Tax-Free Income 3 (NYSE: NXR ) by 6.7%. Auction-Rate Preferred Shares : Each of the 5 High-Leverage funds uses Auction-Rate Preferred Shares (“ARPS”) for their structural leverage. Since mid-February 2008, holders of auction-rate preferred shares (“ARPS”) issued by the CEF’s have been directly impacted by a lack of liquidity. These funds have consistently “failed” because of insufficient demand to meet the supply of such securities. However, as their “failure” to issues such securities, the penalty rates for the securities is a average “maximum rate” equal to the higher of the 30-day “AA” Composite Commercial Paper Rate multiplied by a minimum of 110% or the Taxable Equivalent of the Short-Term Municipal Obligations Rate-defined as 90% of the quotient of (A) the per annum rate expressed on an interest equivalent basis equal to the S&P Municipal Bond 7-day High Grade Rate Index divided by (B) 1.00 minus the Marginal Tax Rate (expressed as a decimal) multiplied by a minimum of 110% (which is a function of short-term interest rates). However, the interest rates on “ARPS” have been below 0.25% points for the hundreds of millions of dollars to “ARPS” debt. This debt is highly accretive to leveraged funds. As with PIMCO NY Municipal Income II (NYSE: PNI ), the average EPS as it related to the dividend is -11.6%. This may be out of line for the High-Leveraged CEF’s. PNI premium is 6.9%. (click to enlarge) Low-Leverage Funds : Nuveen manages each of the 5-Low-Leveraged funds, which have an average coupon rate much lower than that of the 5 High Leverage d funds. This may be due to the level of unrated municipal bonds between the two groups. 3 of the 5 High-Leveraged funds are state municipal funds whereas the Low-Leverage funds only have 1. However, the two High-Leveraged funds that are national have an average 5.1% coupon while the 4 national Low-Leveraged funds have an average 2.8%coupon. It’s seems to me that Nuveen, which has a slew of municipal bonds, may not be paying attention to their holdings. (click to enlarge) Hedge Funds : If interest rates go up at the end of the year, both High and Low Leveraged Closed-End Funds will likely go down so. If you don’t have a “hedge” against MuniBndFnd your stock losses may mount up. We have Muni tax-free ETF known as iShares National AMT-Free Muni Bond (NYSEARCA: MUB ). MUB has a $4.12 billion net assets value (NAV), a 2.7% tax-free yield and a 0.25% expense ratio. Additionally, we have taken a counter indicator to the MUB call ProShares Short 20+ Year Treasury (NYSEARCA: TBF ) . This may cancel out each other when the stock price moves. TBF has a Net Asset Value of 1.06 billion with a 0.92% expense ratio with no dividends. Joe Eqcome, GrowthIncome Research & Management, LLC Scalper1 News
Scalper1 News