Scalper1 News
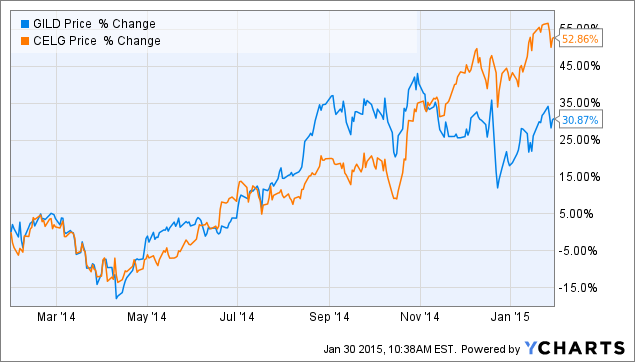
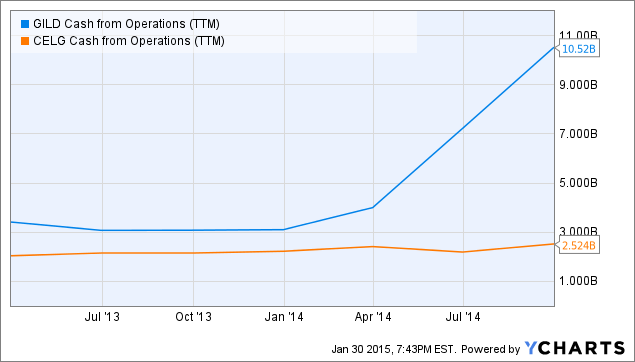
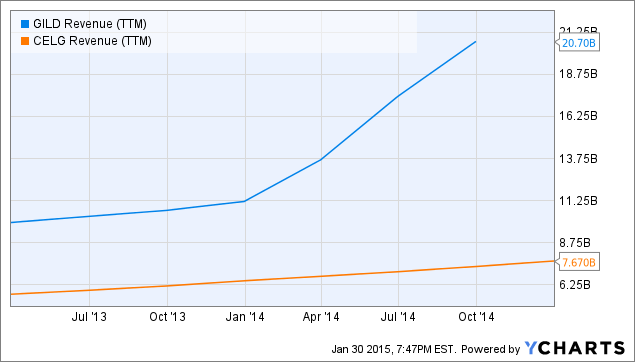
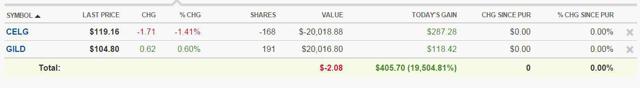 Summary Gilead appears very cheap compared to Celgene. In this article I compare growth expectations to valuation for the two companies. I think that a “pair trade” long Gilead and short Celgene makes sense at this time. Today I am starting a new mock portfolio on Seeking Alpha: the Pairs Trade Portfolio. Every transaction made in the portfolio will be a pair of trades of equal value (as close to $20,000 for each stock as can be), one long trade and one short trade. I plan on adding to this portfolio – and readjusting as necessary – over the next months and years and it will probably end up being a rather large study. The first trade is to go long Gilead (NASDAQ: GILD ) and short Celgene (NASDAQ: CELG ). My apologies for the length and description of this article. As it is the first in the series I will define and describe the strategy of pairs trading in detail here and refer to this page in future articles. Those readers familiar with the concept can skip over the next part and begin reading at the “Gilead vs. Celgene” section below. What is a “pair trade” and why would an investor want to do it? Pairs trading takes two highly correlated investment instruments and essentially pits them against each other. What stock will do better, Lowe’s or Home Depot? Pfizer or Merck? The investor goes long on the stock he/she thinks is undervalued relative to the overvalued one. The (relatively) overvalued one gets shorted. The investor is thus hedging bets and isolating a trade that only takes into account the relative value between two stocks. The strategy is often thought of as a very technical, statistics-driven exercise in which an outperforming stock is always shorted and the underperforming one is always the long. “Reversion to the mean” is counted on to make money in the pair trade. However, I feel that approach is short-sighted and I won’t be a slave to it. There are countless examples of stocks that outperform others consistently despite a high degree of correlation in the short term. Those are cases in which a pair trade with the underperforming stock as the long should be avoided. The motivation for making a pair trade is largely due to the fact that the strategy is a market-neutral hedge. It does not matter if the overall market crashes or zooms to new heights; the investor makes money if and only if the long stock pick outperforms the short stock pick. For example, let’s assume we set up a pair trade that is long Gilead at $100 per share and short Celgene at $120 per share and a market crash hits us in 2014. At the end of 2014, Gilead sits at $60 per share and Celgene goes to $60 as well. If the original position was $20,000 in each stock, then our pair trading investor has made $2,000 during 2014 (long GILD loses $8,000, short CELG gains $10,000) – a gain of 5% overall. Pairs trading is potentially a great defensive strategy. The market-neutral aspect of it makes it something to consider when it appears that stocks are overvalued in general. Pairs trading protects the investor from high valuations. Here’s a simplistic example: an investor believes that company A is a great company in a great industry. He/she really wants to invest in company A but the market is in the stratosphere and A sports a P/E of 70 – the risk seems to outweigh the reward. But he/she sees that company B, which has similar prospects to company A has a P/E of 110. The investor can go ahead and invest in company A as a pair trade with B and those P/E ratios might as well be 7 and 11, or 700 and 1100 for that matter. Recently I hear a lot of statements like “there’s nothing to buy”, “money has to be invested somewhere”, or “I’m afraid of valuations, but I don’t know what else to do but buy and hold.” At this point in time, I feel that every investor should consider any and every conservative strategy available. In my opinion, the US markets are in for a correction and I have written about the macro outlook a couple of times recently: One could think of a pairs trade strategy as another “what to do” when a bear market looks likely. Gilead vs. Celgene Both Gilead and Celgene are large biotech companies (market caps of about $157 billion and $96 billion respectively) and therefore it is not surprising that the correlation between the stock prices of the two companies was high during the past year: GILD data by YCharts A major divergence occurred recently – in early November – when Gilead started drifting lower/sideways while Celgene powered higher. On December 22, GILD took a fairly large plunge when Express Scripts (NASDAQ: ESRX ) announced that it would exclusively cover the AbbVie (NYSE: ABBV ) hep C drug. The question is, does that divergence mean that Gilead is undervalued compared to Celgene? The above chart suggests that might be the case and a further look is in order. I think that GILD is a better buy than CELG and the next sections will cover the growth prospects and valuation comparisons. Growth for Gilead The average analyst estimate for sales growth in 2015 is 17.8%. A quick look at where that growth will come from is in order to see if it makes sense. Estimates for worldwide growth in Sovaldi/Harvoni sales in 2015 are all over the map and while it is certainly difficult to guess where that will land, I’d say a conservative estimate is for 5% growth in sales. I’ve seen estimates from -5% to 30% growth. Sovaldi/Harvoni will likely account for more than half of Gilead’s total sales in 2015, but other drugs are growing fast and becoming more important for the company. In a previous article about Gilead, I noted that: According to Thomson Reuters, sales of idelalisib [Zydelig] are forecast to exceed $1 billion by 2017, with consensus sales forecasts of $1.218 billion that year. Zydelig began sales last quarter and it will be interesting to see how well it did in Q4 2014. It should add somewhere between $500 million to $700 million in 2015. In my article referenced above, I also singled out Stribild and noted that it was expected to see sales of over $2 billion in 2016. In 2014, it should easily clear the $1 billion mark. Like Zydelig, Stribild should also add a considerable amount to the top line. My estimate is an additional $700 to $900 million in 2015 sales. Complera/Eviplera is another in Gilead’s best-in-class HIV stable of drugs that is growing fast. In the first nine months of 2014, sales grew over 60% year to year and will eclipse the $1 billion mark for all of 2014. I expect it to add $500 to $600 million in sales to 2015 figures. A look at Gilead’s most recent 10-Q (see part 13. Segment Information) shows that the other drugs will likely be slightly up or slightly down. Add in any new approvals and there should be slight growth in the “other” category of those products that I did not mention above. Adding everything up (and making some assumptions for Q4 2014) puts my rather conservative 2015 revenue growth at about 12% – 14%. So by my back-of-the-envelope reckoning, the analyst expectations for 17.8% revenue growth look reasonable to me. Growth for Celgene Celgene’s growth is much easier to estimate as the company just gave guidance yesterday. Management expects 2015 revenue to grow 22.3% over 2014. Analyst estimates show a number of 21%, so it looks safe to assume something in the low 20s. Valuation I have recently written about Celgene’s GAAP and non-GAAP reporting in an article titled ” Celgene: Could You Be More Like Gilead, Please? ” and because I believe that the non-GAAP numbers inflate EPS, I will use GAAP figures for the P/E calculations below. Gilead should report EPS of about $7.25 for 2014. At a current stock price of $104.80, that equates to a P/E of 14.5. Celgene has reported EPS of $2.39 for 2014. At a current stock price of $119.16, that equates to a P/E of 49.9. Let’s take a look at cash generation: GILD Cash from Operations (TTM) data by YCharts Gilead’s market cap is about 60% higher than Celgene. However, it generates more than 300% cash than Celgene. The above chart shows the trailing 12 months, so once Gilead’s Q4 results are put into it, the figure will likely be something like 400% more cash from operations. Finally, a look at revenue: GILD Revenue (TTM) data by YCharts Again, Gilead’s soon-to-be-released Q4 results are not included. Once they are, the TTM sales number should be around $23 billion, or 200% higher than Celgene. Conclusion When we look at sales, earnings, and cash flow, we can see that Gilead is at a level anywhere from two to four times higher than Celgene. And yet the market cap of Gilead is only 60% higher than Celgene. 2015 growth estimates favor Celgene by 22.3% to 17.8%. Gilead’s incredible growth in 2014 will plateau and we will see good – but not exceptional – growth in 2015. For that reason, Celgene clearly does deserve a higher multiple, but not a multiple that is more than three times that of Gilead. I expect to see the difference in multiples between the two stocks narrow, thus favoring GILD in a pair trade. The Portfolio So here is what the mock portfolio looks like so far after executing the first pair trade: (click to enlarge) Not terribly exciting yet, but there will be more to come. Be sure to click “follow” if you would like to get real-time alerts on my future articles. Disclosure: The author is long GILD. (More…) The author wrote this article themselves, and it expresses their own opinions. The author is not receiving compensation for it (other than from Seeking Alpha). The author has no business relationship with any company whose stock is mentioned in this article. Scalper1 News
Scalper1 News