Scalper1 News
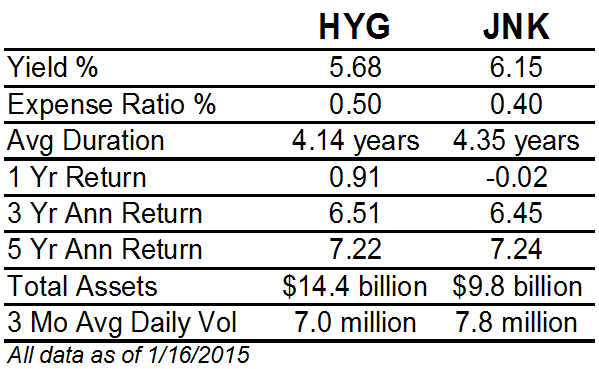
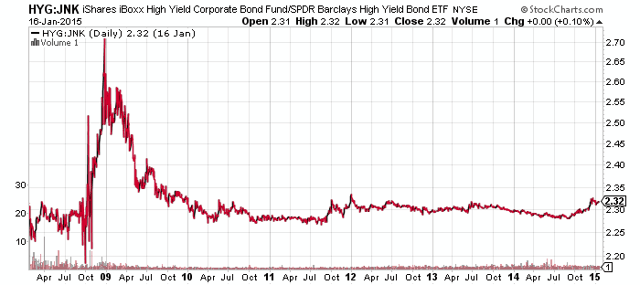
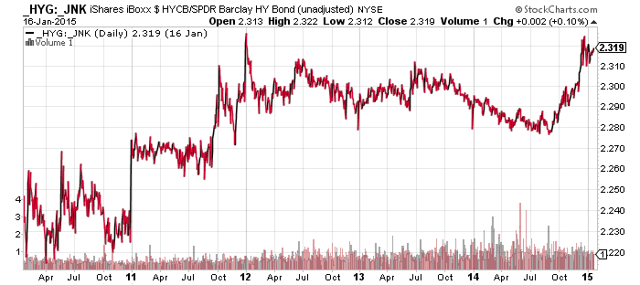
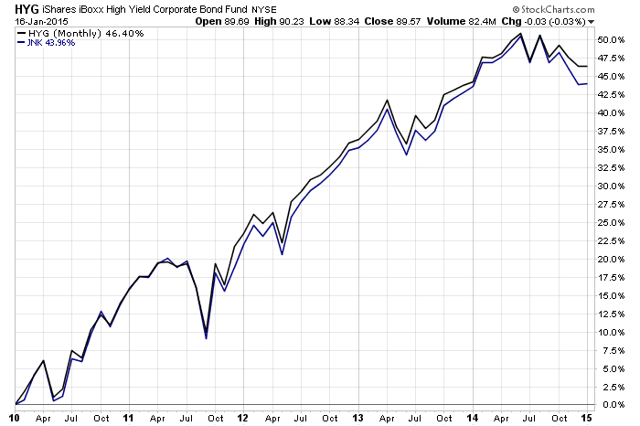
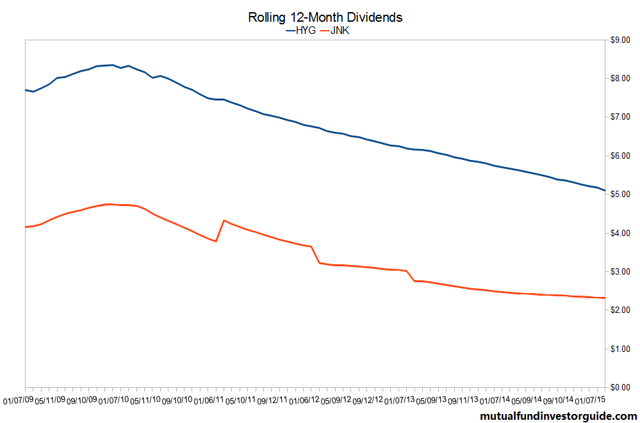
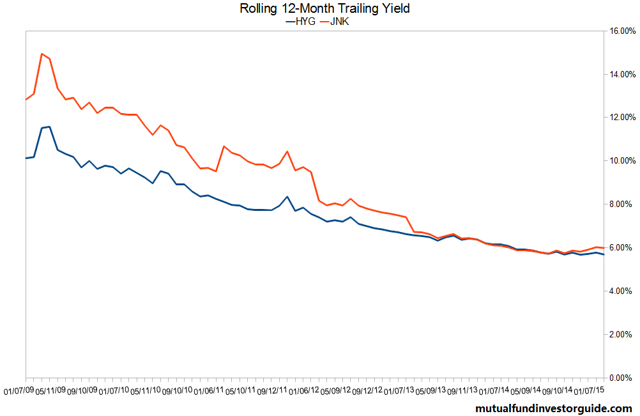 Summary JNK has a higher yield and lower expenses. HYG has higher credit quality and lower volatility. JNK and HYG have near identical returns over the past 5 years. Both have seen their payouts decline along with interest rates. The two largest high yield bond funds are the iShares iBoxx $ High Yield Corporate Bond (NYSEARCA: HYG ) and the SPDR Barclays Capital High Yield Bond ETF (NYSEARCA: JNK ). These funds use very similar strategies that result in largely similar portfolios and performance, with a few small variations. Index & Strategy HYG tracks the Markit iBoxx USD Liquid High Yield Index , while JNK tracks the Barclays High Yield Very Liquid Index. These two funds are highly correlated, to the tune of 0.9985 since 2006. Since 2010, the correlation rises to 0.9995. This comparison of some key data points reveals the main differences between the funds. Through January 16, these ETFs had near identical 3-year and 5-year annualized returns. Investors can pocket a little more income with JNK, but total returns are very similar. Along with that slightly higher yield comes a slightly higher duration, making JNK a little more sensitive to changes in interest rates. HYG has more assets and higher average dollar trading volume. The number of shares traded is very similar, but HYG’s price is more than double that of JNK. JNK is cheaper than HYG, to the tune of 0.10 percent a year. Given the similarities between the funds, the difference in cost is a big advantage for JNK. Even though HYG is at disadvantage on cost and yield, it has managed to outperform JNK. In terms of credit quality, JNK has 40 percent in BB rates bonds; 43 percent in B; and 16 percent in CCC or lower. HYG has 48 percent in BB rated bonds; 39 percent in B; and 11 percent in CCC. Performance This price ratio chart of HYG versus JNK shows the funds move in tandem, except during the financial crisis. Over the past 5 years, the two funds have fluctuated within a range of 3 percent of each other. A rising line indicates HYG is outperforming. (click to enlarge) This price ratio chart compares the price performance of HYG and JNK over the past 5 years without adjusting for dividends. It shows that HYG has benefited more from price appreciation than from income, as would be expected given HYG yields less, yet returns the same in the long-run. (click to enlarge) This chart shows their returns since 2010. (click to enlarge) Income JNK has a higher yield than HYG, but both funds have seen their payout decline amid low interest rates (data from the provider websites). (click to enlarge) The chart below shows the trailing 12-month yields based on actual payouts. JNK was paying more at the start in part because shares did under perform during the financial crisis. The main takeaway is that yields were falling due to falling interest rates (rising bond prices) and if that trend continues, investors will continue to see shrinking payouts. (click to enlarge) Risk & Reward JNK has a 3-year beta of 1.17 versus HYG’s beta of 1.09., both versus the BofAML HY Master II Index. JNK has a 3-year standard deviation of 5.33 compared to HYG’s standard deviation of 5.01. This means JNK is slightly more volatile than HYG. Both funds have exposure to the energy sector, with HYG’s provider listing its exposure at 13.82 percent. JNK does not break out its exposure by sector, but given the volatility in that sector, if it had a meaningful difference in exposure, there would be a considerable difference in returns. JNK is down 1.15 percent in the past three months versus a 0.26 percent drop in HYG. High yield bonds are less sensitive to changes in interest rates due to their lower duration, but they are very sensitive to the economy. In 2008, JNK fell 25.67 percent and HYG lost 17.37 percent. The late 2014 plunge in oil prices weighed heavily on junk bond funds. Including dividends, HYG is down about 3 percent over the past seven months, versus the 4 percent decline in JNK. The most recent turnover data from Morningstar shows JNK had turnover of 30 percent as of June 30, 2014, while HYG had turnover of 11 percent as of February 28, 2014. If HYG has historically maintained this lower turnover, this makes the cost gap smaller than the expense ratio indicates, since HYG would face fewer transaction costs. Conclusion JNK and HYG are very similar funds, but they do have their differences. JNK charges less and has a higher yield, but that comes with higher volatility and lower credit quality. HYG manages to consistently deliver nearly the same total return as JNK though. Overall, this makes HYG the more attractive ETF, especially given our position in the economic cycle. A recession isn’t brewing yet, but it has been seven years since the last one began. With better credit quality, HYG is likely to hold up better again in the next recession. Investors will receive a smaller yield from HYG, but this extra bit of income isn’t worth the risk of under performing the next time the high yield bond market suffers a major sell-off. Short-Term High Yield While HYG is a better choice than JNK in 2015, there are more funds to consider. In part 2, we’ll look at the SPDR Barclays Capital Short Term High Yield Bond ETF (NYSEARCA: SJNK ) and the PIMCO 0-5 Year High Yield Corporate Bond Index ETF (NYSEARCA: HYS ). Scalper1 News
Scalper1 News