Scalper1 News
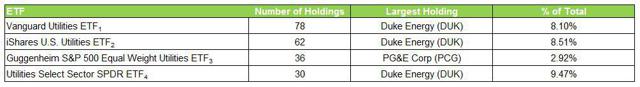
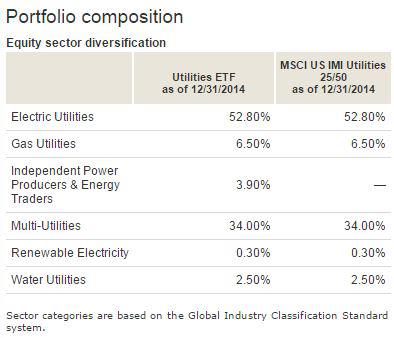
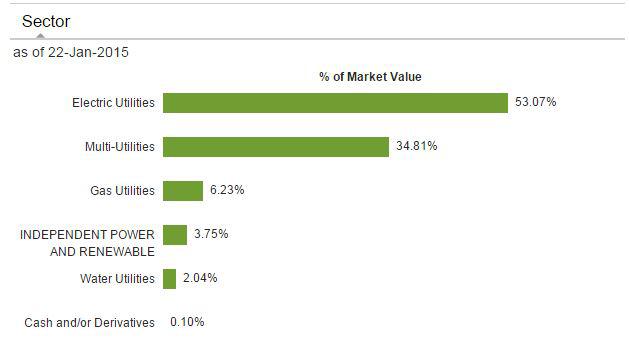
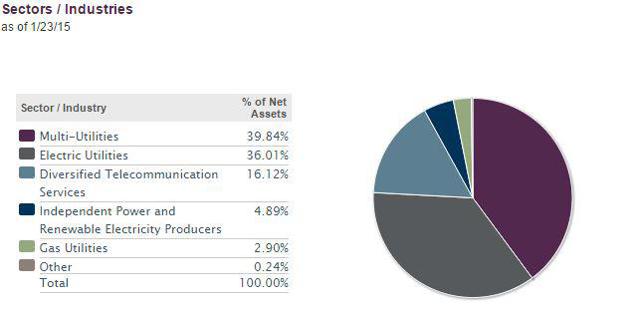
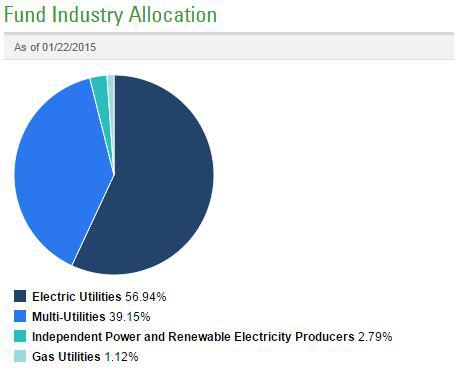
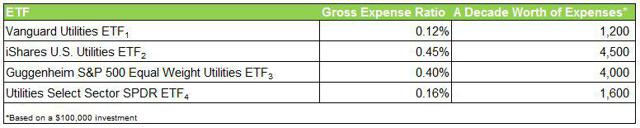
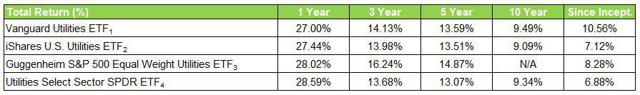
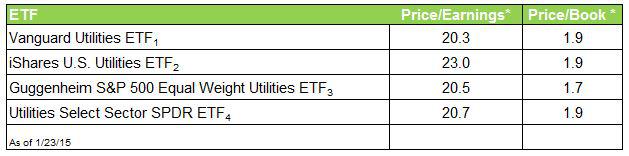
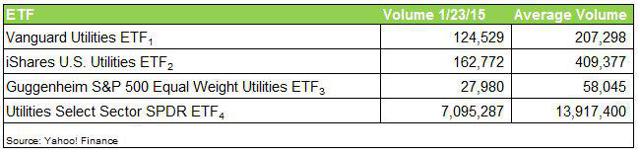
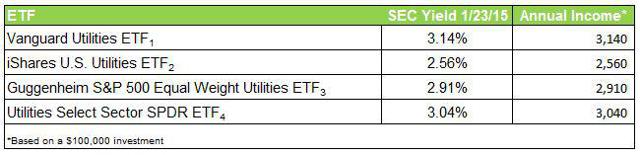
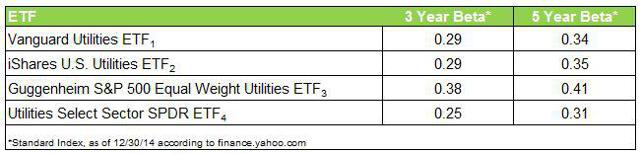
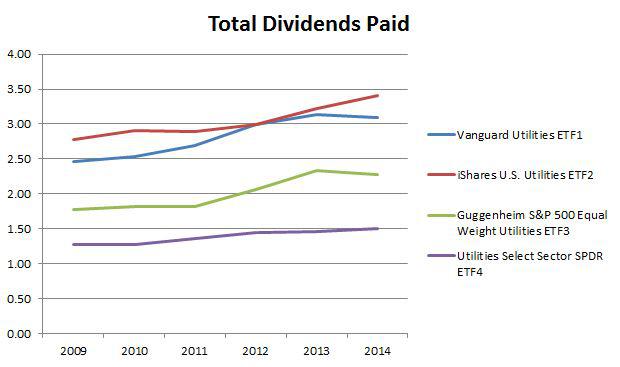 Summary Utilities are a solid income-producing, low volatility plays. Look at utility ETFs as alternatives to one-stock options (Con-Ed, Duke Energy, Dominion) for more geographic and industry diversification. These utilities are largely made in America domestic investment options. Profiling the contenders (unless otherwise stated, market prices, NAV and SEC yield as of 1/23/15) : Vanguard Utilities ETF (NYSEARCA: VPU ) This ETF seeks to track the performance of a benchmark index that measures the investment return of stocks in the utilities sector and includes stocks of companies that distribute electricity, water, gas or that operate as independent power producers. Market price: $106.55 30-day SEC Yield: 3.14% Number of holdings: 78 iShares U.S. Utilities ETF (NYSEARCA: IDU ) This ETF seeks to track the investment results of an index composed of U.S. equities in the utilities sector. Market price: $123.23 30-day SEC Yield: 2.56% Number of holdings: 62 Guggenheim S& P 500 Equal Weight Utilities ETF (NYSEARCA: RYU ) This ETF seeks to replicate as closely as possible, before fees and expenses, the performance of the S&P 500 Equal Weight Index Telecommunication Services & Utilities. Market price: $81.17 30-day SEC Yield: 2.91% Number of holdings: 36 Utilities Select Sector SPDR ETF (NYSEARCA: XLU ) This ETF seeks to provide investment results that, before fees and expenses, correspond generally to the price and yield performance of the S&P Utilities Select Sector Index. Market price $49.14 30-day SEC Yield: 3.04% Number of holdings: 30 1) Diversification Diversification is the process of reducing non-systematic risk by investing in a variety of assets or asset classes that (hopefully) do not move up or down in value at the same time or magnitude. As the 2008 financial crisis taught us , there are certain unforeseeable events (think global recession, world wars) that no amount of diversification can protect us from. With diversification, you are at risk, without it you are doomed. a) Number of holdings An ETF does not need to hold every company of every sector that comprises its benchmark index, but 2 – 3 companies per industry is my subjective minimum to achieve adequate diversification. The utilities sector can be broken up into various industries including: electric utilities, multi-utilities, gas utilities, independent power and renewable electricity providers and water utilities. (click to enlarge) Winner: Guggenheim. While iShares and Vanguard both have more holdings, the concentration of risk with Duke Energy should not be ignored. Every dollar invested in Duke Energy is a dollar that can’t be invested in smaller regional electric and water companies that potentially could provide under the radar value for investors. b) Industry concentration Vanguard Utilities ETF (Courtesy of Vanguard) iShares U.S. Utilities ETF (Courtesy of BlackRock) Guggenheim S&P 500 Equal Weight Utilities (click to enlarge) ( (Courtesy of Guggenheim Investments) Utilities Select Sector SPDR ETF (Courtesy of State Street Global Investors) Winner: Guggenheim. I like that it has three industries that make up 10% or more of total investments, compared to only two for the competition. While diversified telecommunication services sounds a lot like AT&T, Verizon et al, this high barrier-to-entry quasi utility addition adds recurring revenue and relatively higher yield to the mix. 2) Expense ratio The SEC defines expense ratio as the total of a funds operating expenses, expressed as percentage of average net assets. The expenses include management fees, Distribution/service or “12b-1” fees, custodial, legal, accounting, etc. Lower expense ratios, either through larger size or smaller nominal expenses mean higher investment returns. (click to enlarge) Winner: Vanguard. John C. Bogle , founder of Vanguard: The grim irony of investing, then, is that we investors as a group not only don’t get what we pay for, we get precisely what we don’t pay for. So if we pay for nothing, we get everything. Honorable mention: the other three. According to Morningstar data , the average expense ratio for similar funds is 1.28%. 3) Total return (click to enlarge) Winner: Guggenheim. The Guggenheim S&P 500 Equal Weight Utilities ETF has outperformed Vanguard, iShares, and SPDR on both three and five year horizons. Past performance is no indicator of future results, naturally, but I believe this result is indicative of a superior indexing methodology. 4) Valuation multiples Winner: Vanguard. The Vanguard ETF is trading at a slightly lower multiple to TTM earnings, and a reasonable price/book ratio related to its competitors. 5) Liquidity The ability to get out of a great investment is just as important as the ability to get in. While ETFs are generally regarded as having higher liquidity than mutual funds (primarily because they can be traded throughout the day, rather than just at the end), there are reasons to avoid ETFs with excessively low volume. Chief among these are higher bid-ask spreads, which may result in the inability to profitably execute a short-term trade (not a real issue for long-term investors). However, one of the issues that arises from low liquidity (a deviation between price and NAV) can actually be an opportunity. If an ETF is trading slightly below its NAV, but the market is not active enough for it to quickly resume equilibrium, you can shave a few points off your basis by looking for opportune entry points. (click to enlarge) (click to enlarge) Winner: SPDR. Higher volume means tighter bid-ask spreads, full stop. 6) Yield (click to enlarge) Winner: Vanguard. Honorable mention: Everyone else. All four ETF options offer better income producing prospects than a 30 year treasury (2.38%), the S&P 500 (1.97%), and Dow Jones Utility Average (2.40%). 7) Volatility (click to enlarge) Winner: SPDR. Over three and five-year time-frames, SPDR has been less volatile than Vanguard, iShares and Guggenheim, and significantly less volatile than markets as a whole. 8) Dividend history and growth Source: finance.yahoo.com Winner: Tie: SPDR and iShares. The SPDR and iShares ETF have increased their annual dividend each year since 2009. Growing dividend payments is one way to try and keep up with inflation, and based on this 6 year time-frame, SPRD and iShares best accomplish this. So, which Utility ETF should you own? SPDR! The Utilities Select Sector ETF by SPDR is: the most active (liquid), the least volatile, offers the second highest yield, the second lowest expense ratio, and is one of only two of the funds analyzed that has increased dividends each year since 2009. A word of caution Utilities stocks are generally thought of as defensive plays, and could underperform in a rising or bull market. Also, significant sustained changes in the cost of energy production and delivery or interest rates could negatively impact all of these stocks. That is no excuse, however for not considering allocating at least a portion of your portfolio to these low-volatility ETFs. Do your homework, review the composition and risk profile of each of these ETFs and monitor your holdings. Scalper1 News
Scalper1 News