Scalper1 News


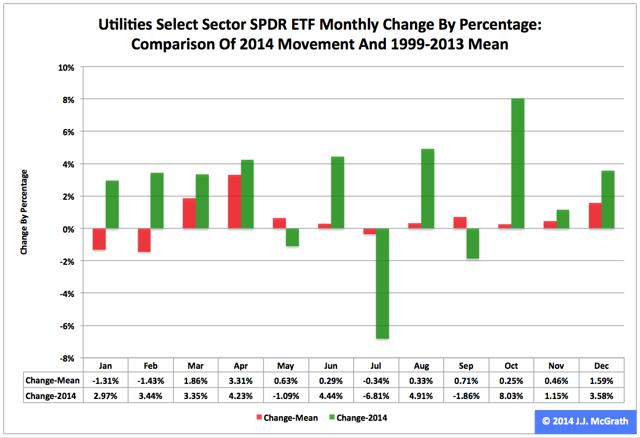
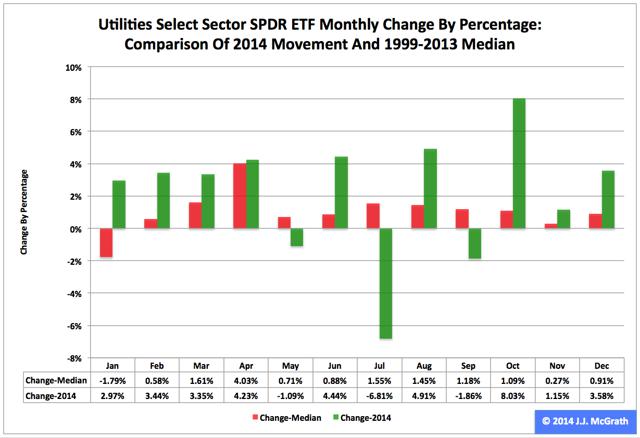
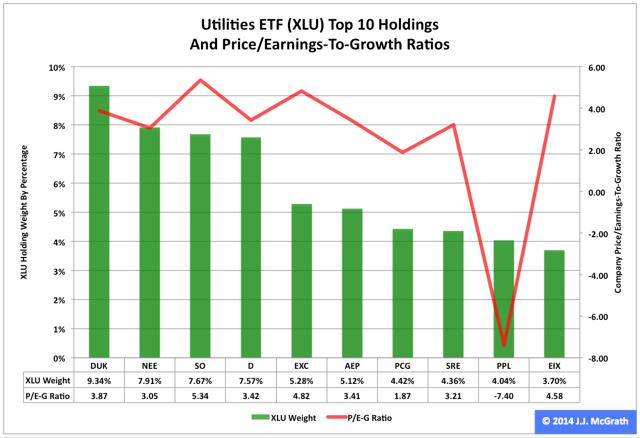
 Summary The Utilities exchange-traded fund finished first by return among the nine Select Sector SPDRs in 2014. As it did so, the ETF posted the best annual percentage gain in its 16-year history. However, seasonality analysis indicates it could be facing a tough first quarter. The Utilities Select Sector SPDR ETF (NYSEARCA: XLU ) in 2014 ranked No. 1 by return among the Select Sector SPDRs that break the S&P 500 into nine chunks. On an adjusted closing daily share price basis, XLU rocketed to $47.22 from $36.68, a zooming of $10.54, or 28.74 percent. Accordingly, the ETF outdistanced its parent proxy SPDR S&P 500 ETF (NYSEARCA: SPY ) by an extraordinary 15.27 percentage points. (XLU closed at $47.35 Wednesday.) XLU also ranked No. 1 among the sector SPDRs in the fourth quarter, as it outpaced SPY by 8.28 percentage points. In addition, XLU ranked No. 1 among the sector SPDRs in December, as it outran SPY by 3.83 percentage points. Overall, XLU posted the best annual percentage return in its 16-year history: Its previous record was set in 2003, when it swelled 26.46 percent. XLU appears key to analysis of market sentiment based on the comparative behaviors of the Select Sector SPDRs . If XLU ranks near No. 1 by return during a given period, then I believe market participants are in risk-off mode; if XLU ranks near No. 9 by return over a given period, then I think market participants are in risk-on mode. Figure 1: XLU Monthly Change, 2014 Vs. 1999-2013 Mean (click to enlarge) Source: This J.J.’s Risky Business chart is based on analyses of adjusted closing monthly share prices at Yahoo Finance . XLU behaved a lot better in 2014 than it did during its initial 15 full years of existence based on the monthly means calculated by employing data associated with that historical time frame (Figure 1). The same data set shows the average year’s weakest quarter was the first, with a relatively small negative return, and its strongest quarter was the second, with an absolutely large positive return. The ETF’s October 8.03 percent gain was its sixth-highest monthly return ever. Figure 2: XLU Monthly Change, 2014 Versus 1999-2013 Median (click to enlarge) Source: This J.J.’s Risky Business chart is based on analyses of adjusted closing monthly share prices at Yahoo Finance. XLU also performed a lot better in 2014 than it did during its initial 15 full years of existence based on the monthly medians calculated by using data associated with that historical time frame (Figure 2). The same data set shows the average year’s weakest quarter was the first, with a relatively small positive return, and its strongest quarter was the second, with an absolutely large positive return. Clearly, this means there is no historical statistical tendency for the ETF to explode in Q1. Figure 3: XLU’s Top 10 Holdings and P/E-G Ratios, Jan. 7 (click to enlarge) Note: The XLU holding-weight-by-percentage scale is on the left (green), and the company price/earnings-to-growth ratio scale is on the right (red). Source: This J.J.’s Risky Business chart is based on data at the XLU microsite and Yahoo Finance (both current as of Jan. 7). In the wake of the sea change in bias at the U.S. Federal Reserve , away from loosening and toward tightening, XLU’s record-setting performance in 2014 kind of makes sense, at least in an equity market where share prices are primarily driven by the ebb and flow of asset purchases made by the central bank under one or another of its so-called quantitative-easing programs. It is worth mentioning in this context that the Fed announced the conclusion of purchases under its latest QE program Oct. 29 and that the ends of purchases under its previous two formal QE programs are associated with both a correction and a bear market in large-capitalization stocks, as evidenced by SPY’s dipping -17.19 percent in 2010 and dropping -21.69 percent in 2011. It is also worth mentioning that XLU’s big-time performance last year means that I, as a growth-and-value guy, see neither growth nor value in most of the utilities sector, as indicated by the above chart (Figure 3) and numbers released by S&P Senior Index Analyst Howard Silverblatt Dec. 31. At that time, Silverblatt pegged the P/E-G ratio of the S&P 500 utilities sector as 3.43. In the current environment, I therefore would be completely unsurprised should XLU continue to behave well in the current quarter, not on an absolute basis but on a relative basis (i.e., in comparison with the other Select Sector SPDRs and with SPY). On balance, the ETF may not produce gains, but it might produce losses smaller than those of its siblings. Disclaimer: The opinions expressed herein by the author do not constitute an investment recommendation, and they are unsuitable for employment in the making of investment decisions. The opinions expressed herein address only certain aspects of potential investment in any securities and cannot substitute for comprehensive investment analysis. The opinions expressed herein are based on an incomplete set of information, illustrative in nature, and limited in scope. In addition, the opinions expressed herein reflect the author’s best judgment as of the date of publication, and they are subject to change without notice. Scalper1 News
Scalper1 News