Scalper1 News
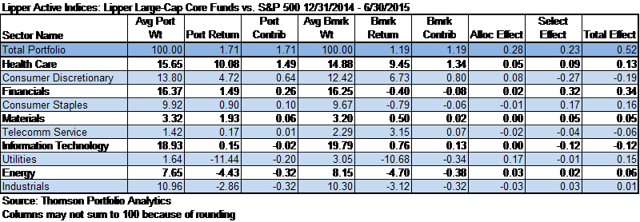 Much has been written about the mass exodus of investors from large-cap actively managed funds over the last several years. For 2014 alone, despite a relatively strong one-year return from the group (+10.72%), investors redeemed some $34.5 billion from actively managed large-cap funds, while they padded the coffers of passively managed funds (+$17.4 billion). Nonetheless, the actively managed large-cap funds group is still the largest group in the equity universe, with $1.6 trillion under management, while its passively managed brethren (excluding S&P 500 Index funds) have a little over $335 billion under management. Although on average passively managed funds have recently outpaced their actively managed counterparts, there are certain times when actively managed funds do indeed outperform. When bull markets start to lose steam and stock picking comes back into vogue or when markets are in a funk, research has shown that actively managed funds are often poised to post better returns than their passively managed counterparts. Year to date through June 30, 2015, in the current sideways market actively managed large-cap funds (+1.95%) have outperformed passively managed (pure index) large-cap funds (+1.33%). Since the performance of active and passive strategies runs in cycles, it’s important to set expectations for clients. To help explain performance trends of actively managed funds vis-à-vis their benchmarks, it’s useful to dive deeper into portfolio practice. For the remainder of this segment we’ll focus on Lipper’s Large-Cap Core Funds (LCCE) classification using attribution-analysis tools. Attribution analysis gives us a way to assign performance qualities to the manager’s portfolio allocation choices (that is, under- or over-allocation to a particular industry, which is referred to as the allocation effect) and to the manager’s stock selection decisions (the selection effect) compared to the composition of the benchmark’s holdings. For 2014, ignoring the impact of expenses on returns, the average actively managed LCCE fund (+13.13%) underperformed the S&P 500 daily reinvested composite (+13.65%) by 52 basis points (bps). In our initial deep dive we note that the average actively managed LCCE fund lagged the benchmark by 2 bps because of allocation effect, while stock selection led to underperformance of 50 bps. In particular, an over-allocation to poorly performing stocks in the finance sector (e.g., Genworth Financial (NYSE: GNW ), Standard Charter ( OTCPK:SCBFF ), and Ocwen Financial (NYSE: OCN )) weighed heavily on active LCCE funds compared with the benchmark, with an economic sector selection effect of minus 51 bps. On the flipside a slight overweighting in consumer discretionary stocks with superior stock returns within the subgroup compared to the benchmark helped the average actively managed LCCE funds’ return, adding 29 bps to the total effect (allocation effect and selection effect combined). However, so far in 2015-and again ignoring expenses-the average actively managed LCCE fund (+1.71%) has outpaced its benchmark (+1.19%) by 52 bps (+28 bps allocation effect and +23 bps selection effect). The average actively managed LCCE fund was slightly over-allocated to healthcare stocks compared to the S&P 500 Index’s allocation, boosting the comparative return 5 bps, while the average portfolio manager’s stock-picking abilities in this sideways market added some 9 bps to the overall return. (click to enlarge) Source: Lipper, a Thomson Reuters company In the analysis above fund expenses are not included in order to provide a true apples-to-apples comparison. This analysis is based on portfolio construction, comparing allocation and stock picking impacts before the consideration of expenses, which are generally easy to assess. Once the trend of the group is found, it is an easy mathematical exercise to slot in expenses. This type of review helps us isolate the pros and cons of various fund groups or individual funds. Attribution analysis can be used as well to highlight funds with superior and inferior performance within a classification, and it can provide a clear explanation of why those findings occurred. As an example, we have identified one of the best performing funds in the LCCE classification over the one-year period ended June 30, 2015, and have run it through attribution analysis to find out how it achieved its outperformance. While this is not a substitution for risk-adjusted return analysis, it provides one more piece of the puzzle, helping us offer detailed explanations to our clients. The following is provided as an example only and is not intended to be a recommendation of any sort. PNC Large Cap Core Fund (MUTF: PLEAX ) posted a one-year return before expenses of 12.66%, while its benchmark-the S&P 500-returned 7.36%. According to attribution analysis, the fund had an allocation effect of 1.28% and a selection effect of 4.02%. While the PNC fund was slightly under-allocated to the information technology sector, providing an allocation effect of minus 0 bps, the portfolio manager’s stock selection within the sector was the primary factor of outperformance, providing a selection effect of 2.51%, with significantly higher weightings to Skyworks Solutions (NASDAQ: SWKS ) and NXP Semiconductors (NASDAQ: NXPI ) being big contributors for the period. Equally, a lower allocation to the underperforming energy sector during the year compared to the benchmark helped the fund mitigate losses to its portfolio, adding 75 bps to the allocation effect. Another, perhaps more recognizable, example is American Funds Investment Company of America (MUTF: AIVSX ) . The fund posts a one-year return of 4.71%, while its benchmark chalks up a 7.36% return. Attribution analysis shows the fund had a negative allocation effect of 1.03% and a negative selection effect of 1.62%. While the fund’s heavier weighting in Merck & Company (NYSE: MRK ) placed a 49-bp drag on the portfolio, it was under-allocated to the healthcare sector compared to its benchmark, tagging on an additional 94 bps of drag from that sector alone. In the passive versus actively managed portfolio debate there are times when one approach is better than the other. Knowing that time can be difficult, so steering clients to both actively and passively managed products can often be the right decision. Providing examples of when certain sectors are out of favor, when markets are flat, or when the manager is truly providing alpha can be shown using attribution analysis, which supports the inclusion of actively managed products. While passive proponents often give the nod to actively managed funds in the less efficient fund groups (emerging markets, small-caps, and municipals), as shown above attribution analysis and good research can help ferret out some hidden gems, even in well-covered, widely held classifications. Editor’s Note: This article discusses one or more securities that do not trade on a major U.S. exchange. Please be aware of the risks associated with these stocks. Scalper1 News
Scalper1 News