Scalper1 News
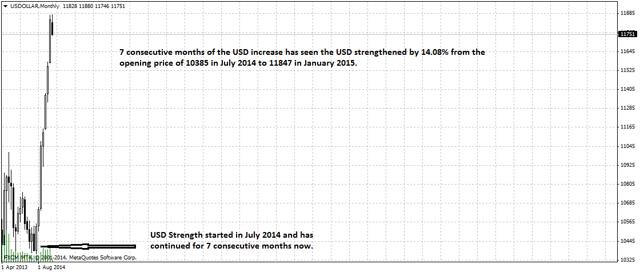
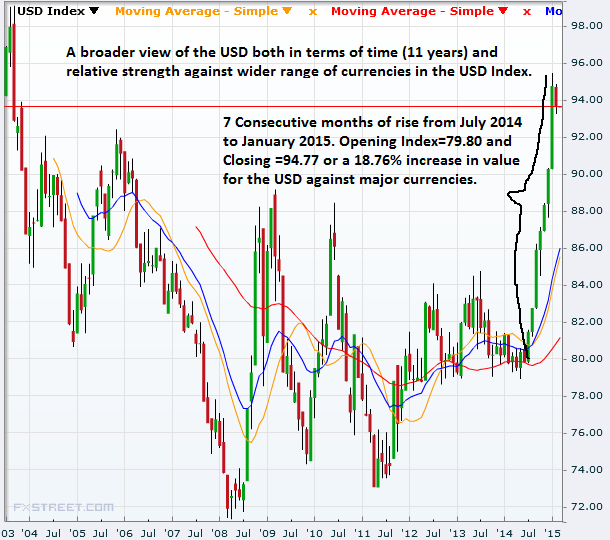
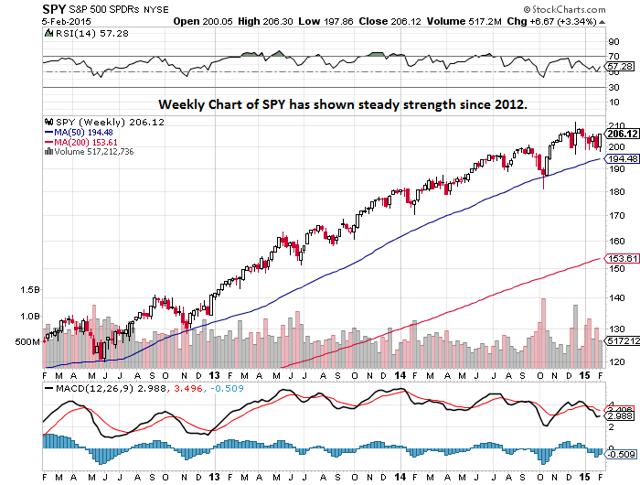
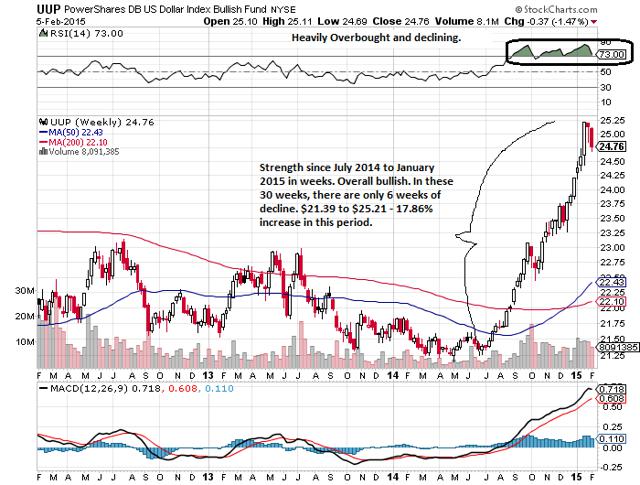
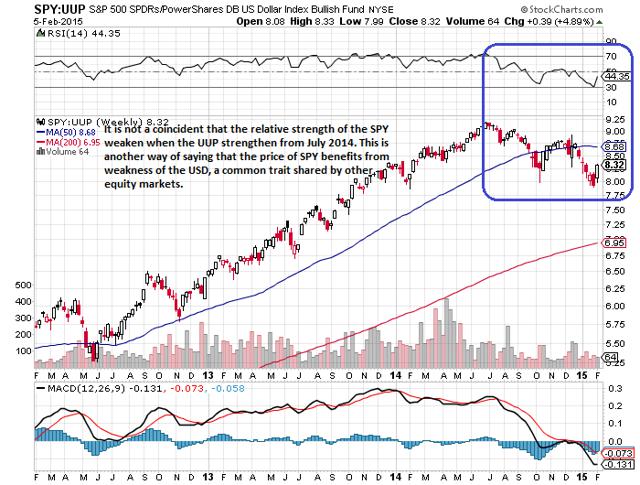 Summary According to different measures, USD has been strengthening for 7 consecutive months now between 14% and 18%. This is due to several drivers of USD strength and the market has priced it in over these 7 months of unprecedented period of strength in the past 11 years. USD is expected to moderate its strength to the range of $24-$25 for UUP from February to May 2015 prior to FOMC liftoff on condition of global status quo. US equity market (as represented by SPY) has strengthened remarkably even in the period of USD strength and is expected to strengthen further during this interim period. Overview of Recent Remarkable USD Strength There is a saying that what comes up must come down. This is the same in the financial sector but there is one asset class which seems to be defying this logic with its relentless rise. That would be the United States Dollar (USD). We can look at the extent of the USD rise through the charts of the FXCM USDollar Index (USDOLLAR) below. (click to enlarge) The USDOLLAR follows the performance of the USD against a basket of the most liquid currencies in the world such as the EURUSD, USDJPY, AUDUSD and GBPUSD. This basket covers 80% of the world spot market activity. This would mean that for the past 7 months, the USD has increased in value by 14.08% against the euro (EUR), Japanese Yen (JPY), Australian Dollar (AUD) and Great Britain Pound (GBP) combined. The USDOLLAR is chosen in the form of its monthly chart to give you an impression of the parabolic nature of the USD ascent visually. The value of a currency lies in its relative value against other currencies. Perhaps, it is because the USDOLLAR only started in April 2013, this is why the effect is so much more dramatic. I will show the more established US Dollar Index later. In any case, we should note that of the countries in currencies mentioned above, only the UK refrained from adding monetary accommodation in the past few months. Europe and Japan has adopted massive Quantitative Easing (QE) to the tune of $1.14 Trillion euros and $80 Trillion yen, respectively, to fight deflation which weaken their currencies. Australia joined in the easing bandwagon when it cut its cash rates by 25 basis points to 2.25% last month to aid its faltering economy despite the threat of a potential housing bubble. The USD Index covers a much broader spectrum of currencies to match against the strength of the USD. They are the EUR, JPY, GBP, Canadian Dollar (CAD), Swiss Franc (CHF) and Swedish Krona (SEK). The USD Index shows that in the past 7 months, the USD has strengthened at a more impressive pace of 18.76% against a wider range of currencies. We can see from the chart above that in the past 11 years, we have not seen a period of sustained 7 months of consecutive advancement as seen from the recent July 2014 to January 2015 period. You can just count the monthly candles in the chart above and not to mention the scale of 18.76%. This is a wider timeframe to look at the strength of the USD which allows us to put things into perspective. This rally has already brought the USD to a 9-year high not seen since November 2005 of 92.43 and just a few points short of the September 2003 peak of 99.12. Recap of Drivers of USD Strength The drivers of the strength of the USD are well known by now, but I shall briefly recap it. The first and foremost driver of the USD strength is the divergence of monetary policy between the US (and maybe the UK to a certain extent) and the rest of the world. Simply put, the Fed is expected to lift off its interest rates in mid-2015 while the rest of the world led by Japan and Europe are expected to increase their degree of monetary accommodation. This market expectation of higher interest rates in the United States has prompted funds that fled to the markets of emerging countries in search of yield when rates were cut back in 2008, to begin the gradual process of return to the United States. Also, funds in Europe and Asia that are in search of greater yield are also attracted to enter the United States market driving up the USD. Secondly, the US has been the lone bright spot in the global economy with growth of 5% in the third quarter of 2014 at a 11-year high and advance estimate of fourth quarter GDP of 2.6%. This stands in contrast to the growth of 0.2% in Europe for the third quarter and -0.5% for Japan in the same quarter after a -1.9% growth in the second quarter. This means that Japan is officially in a recession after 2 consecutive quarters of economic contraction. Thirdly, there is more political stability in the US when compared to Europe. The European Union is facing threats to its integrity with Greece trying to wriggle out of its debt obligation as much as possible and creditors who are not willing to cede ground. This tension will weigh on the economic potential of Europe and there are the lingering concerns over its relations with its giant neighbor Russia over its proxy invasion of Ukraine. This political instability will encourage funds to enter the US in search of safety as much as to tap its economic growth potential. Consolidation of USD Strength and Status Quo All these 3 factors are the reasons behind the strength of the USD over the past 7 months. In this 7 months, the US remains the sole source of strength and stability in the world amongst major economies. However, with a 18% rise, it is clear that the market has priced in these advantages and it is already unprecedented over the experience of a decade. Hence my view is that the USD will consolidate its strength from now in February 2015 to May 2015 until we are nearer to mid-2015. The Federal Open Market Committee (FOMC) will have 2 meetings in June and July 2015. This is the crucial period where the first rate lift-off is expected to occur. The USD might then rise 1 month before that event as the Fed would have given the market more clues in its March and April meetings. We are assuming that the US economy continues on its strong path of economic growth over the next 4-6 months period which will encourage the Fed to raise rates as scheduled. If the US economy shows signs of weakening, the USD would weaken past May 2015 as the market would be less confident of a Fed liftoff. The next assumption is that the European situation will not get worse especially with Greece as it is the precedent for which other debtor nations will follow. Hence even though Greece is tiny in the absolute sense (only 0.39% of the global economy), it will receive determined treatment from the Troika to preserve the interest of creditors. The danger is that they do not push Greece too much which might result in some nasty unintended consequences. We note that although the deadline for the official negotiation is until the end of the month, the European Central Bank (ECB) which is part of the Troika has already expressed disappointment over the negotiations. It has decided that it will not accept Greek bonds as collateral for its monetary policy operations (which is to swap Greek bonds for euros). It has since relegated Greece to the secondary Emergency Liquidity Assistance (ELA) scheme. If European Union were to undo itself back into individual countries, it would be bullish on the USD even if the Fed might be forced to postpone its rate lift-off. Relative Strength of US Equity Market and USD The strength of the economy is often reflected in the strength of its stock market and this is true for the US too. As we have mentioned earlier about the strength of the US economy, we can refer to the S&P 500 SPDR (NYSEARCA: SPY ) to gauge the overall strength of the US stock market. (click to enlarge) We can see from the weekly chart of the SPY above that the overall trend has been bullish. There are ups and downs along the way but the market has always been able to make a comeback. The only time that it has crossed its 50-week moving average was in October 2014 but even that it has been able to recover swiftly. The other thing to note is that in the past few weeks, SPY has stalled and it is ranging in the $200 to $210 price level. (click to enlarge) The other way to look at the USD would be through the PowerShares DB US Dollar Index (NYSEARCA: UUP ) as seen in the chart above. The USD has risen 17.86% from the closing price of $21.39 at the week ending 30 June 2014 with the closing price of $25.21 to the week ending 20 January 2015. It should also be noted that the UUP has been heavily overbought for weeks now. The UUP is likely to range between $24-$25 in the months ahead to May 2015, if the global status quo remains. Hence given that the half the profits of large US corporations are based overseas, the interim USD weakness would have a bullish impact on their earnings during this period. One way where we can gauge how the USD affects the performance of businesses in the US is to overlay the SPY against the UUP. The effect is shown in the chart below. (click to enlarge) The SPY/UUP overlay shows us that the SPY has weakened relatively compared to its performance before July 2014 when the USD strengthened. This is not easily discernible in the SPY chart above. This also goes to show that the SPY has been performing quite resiliently in the face of USD strength. This has to do as much with the fundamental earnings of the underlying companies and the overall appeal of US equity markets as Japan and Europe struggle. With the upcoming interim weakness of the USD, it is likely that the SPY will pick up strength and this would be a good time to pick up SPY for some short-term gains. However, it will also be a good addition to your long-term portfolio as the US economic strength is expected to persist for the foreseeable future. Disclosure: The author has no positions in any stocks mentioned, and no plans to initiate any positions within the next 72 hours. (More…) The author wrote this article themselves, and it expresses their own opinions. The author is not receiving compensation for it (other than from Seeking Alpha). The author has no business relationship with any company whose stock is mentioned in this article. Scalper1 News
Scalper1 News