Scalper1 News
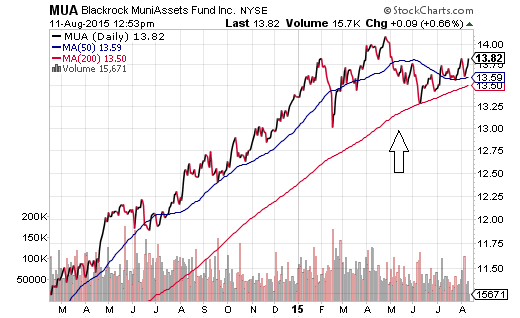
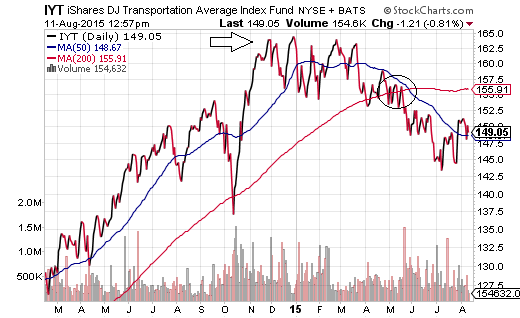
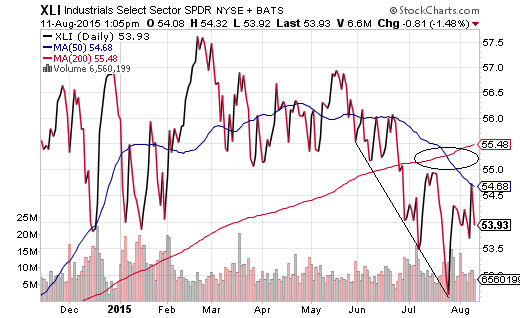
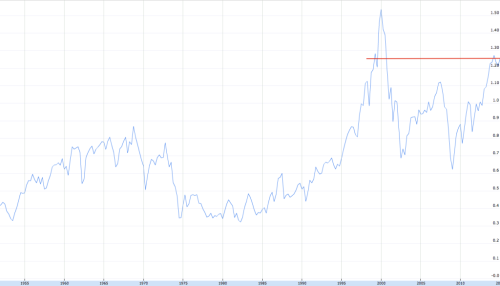
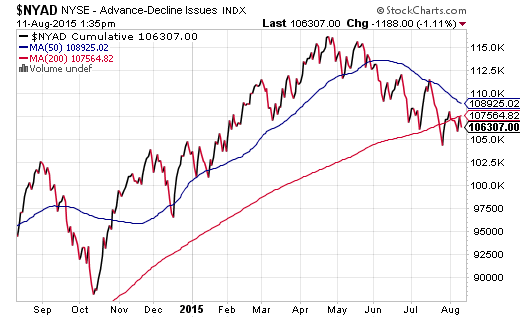
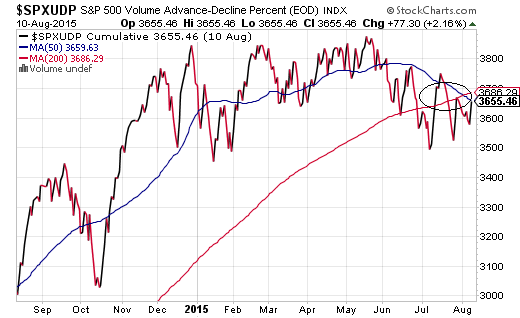 By itself, a “death cross” may not be particularly meaningful. However, when both the Dow Jones Industrials and the Dow Jones Transportation Average are flashing warning signs, stock valuations as well as risk preferences become increasingly important. As I have written previously, a tactical approach to asset allocation does not require that you abandon participation altogether. These tactical shifts will weather a hurricane, as well as permit me to raise risks at more attractive prices. A fair number of commenters, callers and perma-bulls were relatively tough on me in May when I suggested a strategic decision to raise cash levels . They were even tougher on me when I mentioned the possibility of picking up safer havens like intermediate treasuries via the i Shares 7-10 Year Treasury Bond ETF (NYSEARCA: IEF ) and intermediate-to-long duration municipal bonds via the BlackRock MuniAssets Fund (NYSE: MUA ). There’s no doubt about it… I was early on the call. Yet the idea behind raising cash as well as bolstering one’s allocation to investment grade securities (e.g., treasuries, munis, etc.) emanated from a well-reasoned interpretation of the data. At the corporate level, earnings growth had been waning, revenue had been contracting and non-financial companies had more leverage (37%) than they had back in 2007 (34%). At the macro-economic tier, wage increases had been flatlining, manufacturing had been crumbling and transporters in the iShares Transportation Average ETF (NYSEARCA: IYT ) had been dying a death by a thousand small cuts. Keep in mind, many had been dismissing the struggles of shippers, truckers, railways and airlines as irrelevant. After all, the big industrials were not tanking in the same manner as the big transporters. Until now. Industrial corporations – both in the Dow Jones Industrials average as well as the Industrial Select Sector SPDR ETF (NYSEARCA: XLI ) – have succumbed to the same technical pattern of weakness. Specifically, the shorter-term 50-day moving average has crossed over and below the longer-term 200-day trendline (a.k.a. “the death cross”). By itself, a “death cross” may not be particularly meaningful. However, when both the Dow Jones Industrials and the Dow Jones Transportation Average are flashing warning signs, stock valuations as well as risk preferences become increasingly important. Back in May and in June, valuations across nearly every metric of respectability had already reached the 2nd priciest in history (2nd only to the year 2000). Consider Buffett’s favorite indicator, market cap to GDP. As of this moment, the Wilshire Total Market Index market cap is roughly $21850 billion. That’s 123% of GDP. By this metric, the US stock market is only expected to annualize at about 0.3% with returns from dividends over the next decade. (See Market Cap To GDP chart below.) As I warned back in early June , investors would, at that time, need to monitor the market internals to gain perspective on risk-averse behavior. Risk-off behavior had not yet materialized completely. Here on August 11, the NYSE A/D Line’s 50-day trendline has not yet crossed over and below its 200-day moving average. It appears poised to make that transition. Yet equally concerning is the reality that the A/D Line itself had fallen below its 200-day for the first time since July of 2011 . Meanwhile, there have been a series of lower lows for the A/D Line since I first began highlighting market internals in May. Risk preferences – risk-taking versus risk-aversion – can be witnessed across a variety of measures and a variety of asset types. Indubitably, risk-aversion has the momentum, whether one is looking at recent relative performance of large-cap over small-cap, domestic over foreign, or investment grade credit over higher-yielding credit. Over the last two months, IEF has gained 3.1% whereas the iShares iBoxx $ High Yield Corporate Bond ETF (NYSEARCA: HYG ) has lost 1.7%. The demand for safety is trumping the risk of “junk.” One final sign that serves as a huge “yellow” caution: the S&P 500’s Advancing-Declining Volume Line (AD Volume Line). In essence, if the AD Volume Line is rising, there is significant strength behind advancing stocks. If it is falling, however, you have significant selling pressure behind the decliners. Right now, the S&P 500’s AD Volume Line isn’t just falling. Its 50-day moving average has fallen below its 200-day moving average for the first time since… yes, you guessed it… July 2011. By way of review, extreme valuations for equities have existed for the better part of a year. (Note: This can viewed a dozen ways at my “Don’t Party Like It’s 1999″ commentary.) Macro-economic weakness has been getting weaker, whether it is the lack of consumer spending, the breakdown in business spending, manufacturing woes, wholesale inventory buildups, export deceleration, slumping commodities, wage flatness and/or labor force participation. Micro-economic concerns may be summed up with earnings stagnation and the “revenue recession.” (Note: I discussed the “macro” and “micro” at great length at the end of July in “5 Reasons To Lower Your Allocation To Riskier Assets.” ) And market internals? Nearly every conceivable way that I’ve looked at them – from lack of breadth in equities, to missteps by leaders like Apple (NASDAQ: AAPL ) and Disney (NYSE: DIS ) to widening credit spreads to treasury demand – “risk-off” is garnering the limelight. As I have written previously, a tactical approach to asset allocation does not require that you abandon participation altogether. I have moved the bulk of my client base (over the last three months) from a 65% equity stake (e.g., domestic, foreign, large, small, etc.) and 35% income position (e.g., short, long, investment grade, higher yielding, etc.) to something that might resemble 55% stock (mostly large-cap domestic), 25% income (mostly investment grade) and 20% cash/cash equivalents. Cash today will reduce the adverse impact of significant price depreciation. The same can be said for larger domestic companies faring better in the storm than foreign companies or smaller corporations; similarly, investment grade should provide relief where higher-yield debt is likely to struggle alongside other riskier assets. In other words, these tactical shifts will weather a hurricane, as well as permit me to raise risks at more attractive prices. Additional evidence of market internals “rolling over” completely might encourage the use of other “risk-off” measures. For instance, 55% stock might be lowered to 40%, bolstering the overall cash stash to 35% (or one-third). Another possibility? Multi-asset stock hedging. My colleague and I created the FTSE Multi-Asset Stock Hedge Index (MASH) for those who wish to neutralize stock crises and stock bears without using leverage, options or shorting. Components of the index include ETFs like the PIMCO 25+ Year Zero Coupon U.S. Treasury Index ETF (NYSEARCA: ZROZ ), the PowerShares DB USD Bull ETF (NYSEARCA: UUP ), the CurrencyShares Swiss Franc Trust ETF (NYSEARCA: FXF ) and the iShares National AMT-Free Muni Bond ETF (NYSEARCA: MUB ). Click here for Gary’s latest podcast. Disclosure: Gary Gordon, MS, CFP is the president of Pacific Park Financial, Inc., a Registered Investment Adviser with the SEC. Gary Gordon, Pacific Park Financial, Inc, and/or its clients may hold positions in the ETFs, mutual funds, and/or any investment asset mentioned above. The commentary does not constitute individualized investment advice. The opinions offered herein are not personalized recommendations to buy, sell or hold securities. At times, issuers of exchange-traded products compensate Pacific Park Financial, Inc. or its subsidiaries for advertising at the ETF Expert web site. ETF Expert content is created independently of any advertising relationships. Scalper1 News
Scalper1 News