Scalper1 News
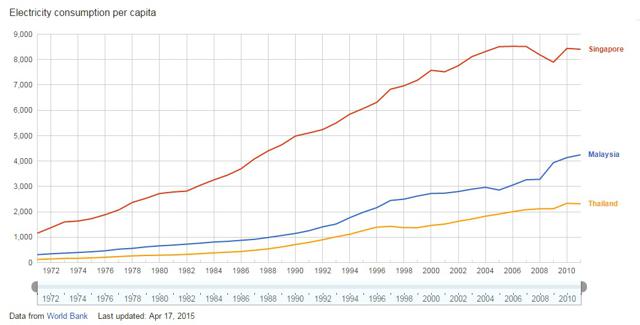
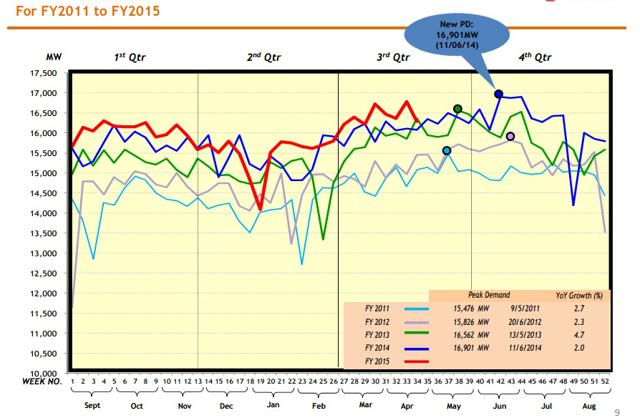
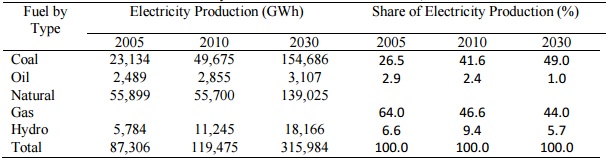
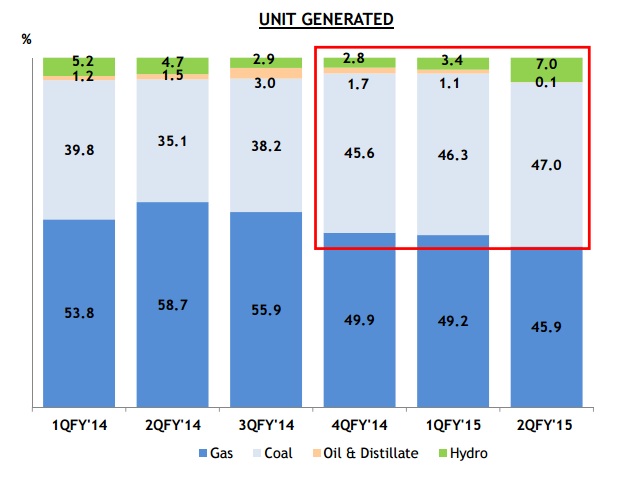
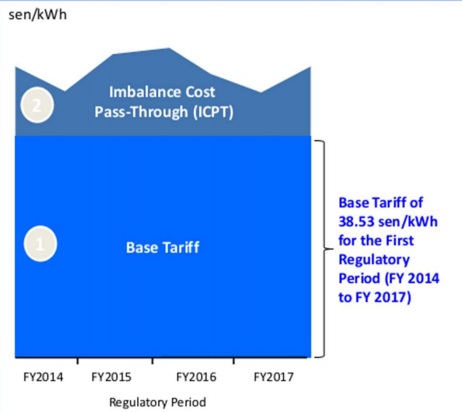
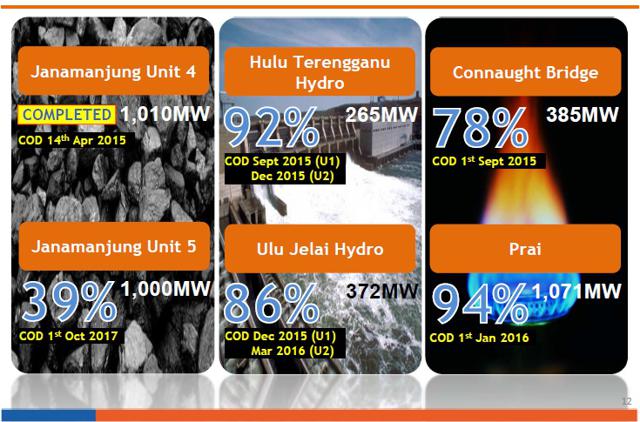
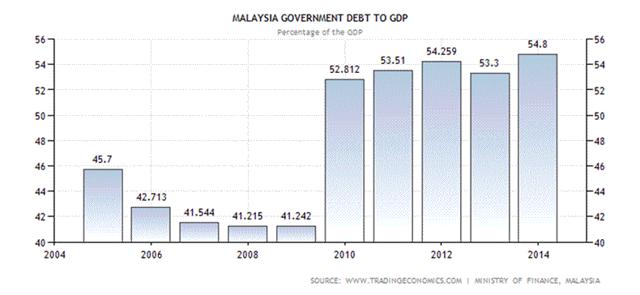
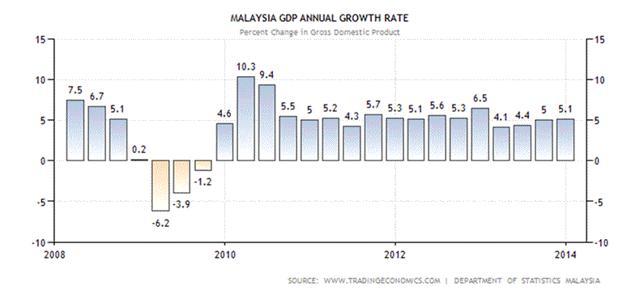
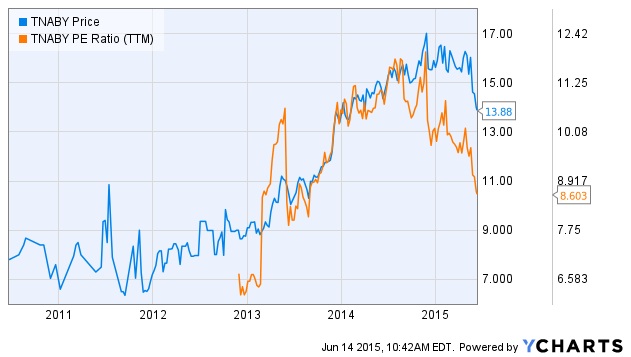
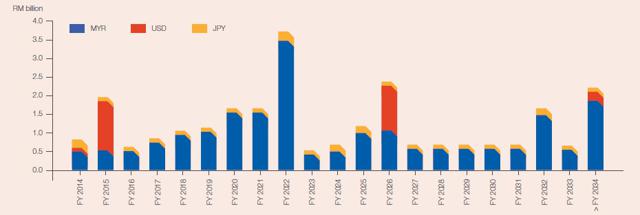 Summary The company benefits from the growth of electricity consumption in Malaysia which is set to double in the next 15 years. Tenaga is going to increase its total capacity by 30% by the end of 2017. The regulatory landscape in Malaysia does not set any hurdles for coal fired power plants, unlike in much of the developed world. Often times opportunities lie where people tend not to look. While the current stock market valuation makes it more and more difficult to find solid companies at great prices with compelling outlooks, there are still gold nuggets to be found if one dwells deeply into the fringe areas of the market, which are poorly covered and exactly where the greatest opportunities lie in the first place. Tenaga Nasional Berhad ( OTCPK:TNABY ) is the largest electric utility company in Malaysia with about $29.7 billion in assets and total installed capacity of roughly 13,000 MW (14,000 MW if Manjung 4, which went online in April this year, is included). About 93% of the capacity is made up of coal and gas fired power plants and the remaining 7% is hydro power. The majority stake in the company is owned by the Malaysian state, as the future success of the company is of strategic importance for the South-East Asian country. The expansion of the total generation capacity is vital for the country’s economic progress. First, let’s take a look at the macro view of the Malaysian electricity market and the TNB’s position in it. Usually foreign equities trade with an inherent discount compared to companies in the U.S. and Europe with a similar asset base. This is true for TNB as well, as investors perceive higher risk considering the geographic region and the potential for political turmoil. Although as I will argue later in this article, Malaysia provides more stability for a primarily coal/gas based utility than the Unites States. Whether the perceived risks are realistic or not doesn’t matter for the stock market as the discount can stem just from the sentiment only. A researching arm of The Economist ranked Malaysia among the countries with very low risk of social unrest, while neighboring Thailand, Indonesia and Philippines received medium to high risk status. This goes to prove that one can not make generalizations about a country just because the media may portray the region as unstable. Now that we have established that the Malaysian social situation is stable enough for the utility business, it’s time to take a look at the long-term trends that provide the necessary top-down framework for the bull thesis. First, the electricity consumption per capita has been growing at a fast pace – up roughly 50% in the past 15 years as can be seen from the chart below. (click to enlarge) And another chart to complement the previous one, showing new peaks in consumption year over year. (click to enlarge) Source: Quarterly report The future outlook is positive and the growth in electricity consumption will go hand in hand with the expanding GDP of South-East Asian countries. The Economic Planning Unit (EPU) of Malaysia is projecting the current consumption of roughly 125,000 GWh to reach 315,000 GWh by 2030, essentially doubling over the coming 15 years. To reach the goal and keep up with the growing demand, the only viable option is to build more base capacity – coal and gas. The same analysis, which is based on EPU’s data, is predicting the electricity mix to remain roughly the same in face of this rapid growth. Projections of consumption and the share of electricity production per fuel type Source: Electricity energy outlook in Malaysia While many have called the political actions of the U.S government “War on Coal” and the carbon legislation is definitely pushing the electricity production to alternatives, TNB does not have this problem as Malaysia’s leadership is aware that the only way to keep up with the consumption is to aggressively invest in base power plants. These aligned goals of the Malaysian government and TNB provide a fertile ground for future growth without worries for potential regulatory scrutiny. And as gas and coal remain the goal (no pun intended), all that remains for TNB to do is to stay on the course and reap the benefits by expanding capacity – pretty straight forward. Below is a summary of TNB’s generating mix by fuel type. The Fuel Mix Source: Latest Quarterly Report The bear market in the energy sector has benefited TNB as the historically low natural gas and coal prices have brought down the input costs. With no substantial shift in the fundamentals (supply/demand imbalance induced glut is here to stay) in sight, TNB will be seeing its benefits in the form of higher margins. Even the first half of the financial year 2015 already saw a substantial improvement in EBITDA margins compared to the same period last year, up from 27.5% to 37.1%. The takeaway here is that if the primary energy prices remain at these low levels, the elevated margins are to be expected going forward. The Catalyst The company has been aggressively investing in its CapEx program and is on track to add 3,800 MW of capacity by the second half of 2017 – a 30% increase in total capacity . Given that the current capacity for Q2’15 (Dec-Feb) was roughly 13,000 MW (excluding the Manjung 4’s 1,000 MW that went online in mid April this year) and the total production was 27,197 GWh which generated a revenue of $2.86 billion (MYR/USD Exchange rate of 0.27), we can roughly estimate the impact that the extra 3,800 MW is going to have on revenues. The assumption is that the capacity utilization remains at similar levels and the revenue per unit stays roughly constant at $105 MWh ($0.105/kWh). The 30% increase in the total capacity will result in a roughly equal rise in the revenue, ceteris paribus, which translates into an extra $850 million per quarter or $3.4 billion per year. Of course, the main variable that will determine the margins and profitability is going to be fuel cost, but as stated before, the situation in the natural gas/LNG and coal markets is likely going to be a tailwind for the foreseeable future. What’s more, the current contracts allow for a tariff raise in the event of a drastic fuel cost rise as can be seen from the chart below. Tariff Breakdown Source: Q2 Report The key takeaway here is that the company is on track for massive top line growth, and given the nature of the utility business – secure revenues and long-term contracts – the bottom line margins are expected to remain at roughly the current levels, meaning that the 30% in capacity growth will show up in the EPS with minimal deviation. Below is a timeline for the projects currently under construction: (click to enlarge) Source: Company’s Presentation The Main Risks The main risk for foreign investors buying shares in the company is the exchange rate, which can either make or break the investment. The past 10 years have seen constant annual deficits that have brought the public debt to 52% of the GDP. Now this is not catastrophic, but in this case, the trend is not your friend, although the ratio has seem to have hit a plateau. Malaysia’s Debt/GDP (click to enlarge) Moreover, at this point it seems that the growth in GDP can outpace the debt. Historical GDP Growth (click to enlarge) Another risk associated with the investment would be the bursting of the bubble in China which would likely cause a contagion in the region – magnitude of which is unpredictable. Still, I believe that TNB’s fixed revenue streams will provide the necessary shelter, should this scenario come to life. The Valuation The recent quarters and semi-annual results are indicating that the year end EPS for FY 2015 is going to land somewhere around RM 1.5-1.6 (first half of the FY 2015 brought in RM 0.785 in net profits per share), which puts the P/E ratio at 8.5. Remember, that the revenue generated by the Manjung 4 unit, which went live in April, is not reflected in the current results, making the above estimates conservative. Assuming that the 30% revenue increase, that was discussed before, adds to the bottom line net profit with similar margins, the EPS for FY 2017 would be somewhere around RM 2, which translates to a forward P/E of 6.6 with the current stock price of RM 13.2. This puts the forward P/E at the absolute bottom of the historical range as can be seen from the graph below. Notice that for the calculations above, I used the original currency for the sake of simplicity. Dividend and Debt The company also pays a dividend and the official policy is to pay out 40%-60% of annual free cash flow (Cash Flow from Operations – Normalized CapEx). This means that the aggressive growth discussed before would not tamper the dividend as only the maintenance CapEx is accounted in the Free Cash Flow calculation. The growth CapEx is financed by debt. As of now, all of the large growth CapEx projects are already accounted for on the balance sheet. The net debt is currently at RM 21 billion ($5.7 billion), 99.6% of which is with fixed rates, protecting against any potential fluctuations in the interest rate, and for the coming few years, there are not many major payments due, except for the USD denominated loan this year as can be seen from the chart below. This payment is easily covered with the cash on the balance sheet (RM 10 billion). Debt due (click to enlarge) Source: 2014 Annual Report The Takeaway TNB’s business model offers great visibility of future revenues and the coming expansion of total capacity is going to act as a catalyst for revenue growth. This translates into a rare mix of stability and recurring revenues, while allowing for an explosive growth of roughly 30% over the coming 2 years. As discussed before, the forward P/E of 6.6 puts the ratio at an absolute bottom of the historical range, acting as a limit to the downside, providing a risk/reward profile that is greatly skewed to the upside. Editor’s Note: This article discusses one or more securities that do not trade on a major U.S. exchange. Please be aware of the risks associated with these stocks. Disclosure: The author has no positions in any stocks mentioned, and no plans to initiate any positions within the next 72 hours. (More…) The author wrote this article themselves, and it expresses their own opinions. The author is not receiving compensation for it (other than from Seeking Alpha). The author has no business relationship with any company whose stock is mentioned in this article. Scalper1 News
Scalper1 News