Tag Archives: xom

Should We Be Getting Ready To Cover Our Shorts In Energy?

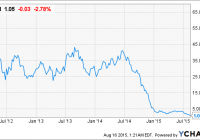
Summary Crude oil priced in gold is near a 30-year low. Crude oil priced in inflation-adjusted dollars tells another story. What are the crude/gas ratios and technicals telling us about our short positions? Getting paid to be patient while we wait for the bottom in energy markets and stocks. Now that oil and gasoline cost less than bottled water, maybe it’s time to start looking at covering our short positions. Don’t get me wrong; I’m not ready to use the L word just yet (long), but I can clearly see long positions on the horizon at lower levels. The downward spiral is still intact, but history has proved short-selling parties can’t last forever. Just how inexpensive is crude oil? Let’s look at the 30-year chart for a barrel of crude priced in gold. All-time high 0.15050 of an ounce, June 2008. All-time low 0.03322 of an ounce, July 1986. Current 0.03370 of an ounce, December 2015. 1986-2015 average, 0.69889. Distance from the all-time low priced in gold 0.00048 of an ounce or about 50 cents. Source & supporting data Federal Reserve data 1986-2105-cost-of-oil-priced-in-gold 1986-2015 oil gold ratio (oil normally trades above gold on this ratio) Source Federal Reserve Is $34.52 per barrel misleading if you look at the historical price action from 1993-2015 calculated in inflation-adjusted dollars? All-time high $147.27 per barrel, July 2008 ($162.34 in 2015 USD). All-time low $10.35 per barrel, December 1998 ($15.80 in 2015 USD). The 30-year average price for oil is $42.87 ($59.09 in 2015 USD). 2015 dollars generated using the bls.gov inflation calculator . Current cash oil price $34.52 per barrel Data source Chicago Mercantile Exchange The fundamentals are still weak The technicals are still weak Daily = downtrend Weekly = downtrend Monthly = downtrend The spread between a gallon WTI crude and wholesale gasoline is more than twice the historical average. 1990-2015 historical average, $0.2147 ($0.28 in 2015 dollars). Current 12-month rolling average = $0.4426. Spread between WTI crude and retail gasoline, better than average. 1990-2015 historical average is $0.8642 ($1.14 in 2015 USD). Current 12-month rolling average = $1.2612. Spread between wholesale and retail gasoline, consistent with the historical average. 1990-2015 historical average is $0.6496 ($0.86 in 2015 USD). Current 12-month rolling average = $0.8186. Where the futures market is pricing crude oil through December 2024. Ratios tell me to maintain shorts, technicals say stay short, futures markets indicate higher prices. One current crude oil position to track Short March 2016 deliver at $46.80, contract value $46,800. Deposit posted per contract = $15,000. Exchange margin per contract = $3,800. March 2016 is currently trading at $36.74, contract value $36,740. I’d like to cover these $46.80 shorts, reverse to long at $33.00. 1) To cover my $46.80 shorts, I’m going to write a put at the $33.00 strike , collecting $1.24 per barrel or $1,240 per contract (expires in 58 days). The only way my current $46.80 short can be “pulled” away is if the market falls from the current price of $36.74 down to $33.00. Should this occur, my short position would appreciate by another $3,740 per contract between now and 17 February 2016 expiration. If March delivery never goes down to $33.00, I keep the $1,240 put premium collected against my $46.80 short. 2) I’m also going to write another put at $33.00, collecting another $1,240. Again, if March 2016 WTI crude does not trade down to $33.00, I keep the $1,240 in time premium. If it does go below $33.00, I was paid $1,240 to enter a new long position at $33.00 or $3,740 per contract better than where the market is currently trading ($36.74), (yes, I’ll have to offset and roll the position in March). 3) If the market stays the same, I’ve collected $2,480 over the next 58 days on a position if delivered is worth $33,000. 4) If oil starts to rally, I can cover my $46.80 shorts and watch the $33.00 puts expire worthless (+$2,480). There are several other ways to offset my $46.80 shorts, example, writing an in-the-money put at $40.00 currently trading at $4.59, collecting $4,590 in premium ($920 in time value). On the upside, the current position is trading at $36.74 contract value $36,740 (1,000 barrel contract x $36.74 per barrel) or I’m getting paid 6.750% in total time value over the next 58 days to liquidate my $46.80 if the market goes down to $33.00. If $33.00 in put is hit, my gain on the trade = $13,800 per contract plus the collected time value of $2,480 for a total of $16,200. The margin I’m allocating on this position is $15,000 per contract ( exchange margin = $3,800 per contract). What this strategy has done is paid me 16.53% in option time value on my $15,000 deposit per contract to be patient over the next 58 days. Many traders don’t realize how collecting fat time premium can work for you. Let’s assume the market is right and crude oil bottoms at the current price of $36.74 (March 2016 delivery). Let’s assume you go long crude oil at $36.74, wrote an out-of-the-money call at $39.50, and the $39.50 call is trading at $1.59, then you’re collecting $1.59 per barrel, $1,590 per contract, $27.41 per day or $10,006 per year on a position that has a total value of $36,740. The time value writing out-of-the-money options = 27.23% in annual time premium collected or 66.70% on the $15,000 allocated to cover the $3,800 in exchange margin. We’re posting $11,200 more than is required by the exchange to minimize the probability of a call. Our margin for error without being in jeopardy of having a call is $11.20 a barrel plus whatever option premium collected; in this case, $1.59 for a total of $12.79. In order for us to be on call (in this example) March 2016, crude oil would need to fall below $23.95 a barrel between now and 17 February 2016 (58 days). Again, I’m not advocating getting in at $36.74, I’m using this as an example to show you how hefty the time premium is writing out-of-the-money calls to generate income against a long crude oil position. In this example, the only way your $36.80 position can be called away from us is at $39.50 for a $2.70 profit per barrel or $2,700 per contract. If it does not get called away, we’d keep the time premium against our long of $1,590 (+10.60% on the $15,000 deposit for 58 days). In my case, I’m writing the $33.00 put to get into a $33.00 long position collecting $1,240 in time value; if delivered at $33.00, I’ll write the $36.00 or $37.00 call against the delivered $33.00 long collecting another $1,000 to $2,500 against the $33.00 long (I will have to roll this position to forward delivery month). Energy Stocks Energy stocks might not be as sick as all the academic chatter generated by the tradeless master debaters. Sure, crude may go down to $20, maybe $10, who cares? There are defined risk strategies to capture the move in both crude and energy stocks if you’re up to speed and can handle the risk. Fact, over the next five years, the world will need energy and the additional products crude produces. Demand may go down, but population will increase, and there are scores of situations that could generate a nice rally in crude from the low $30s as well as energy stocks. Many of these energy stocks you can trade using the same strategy of writing puts to get in and calls to get out as I’ve explained in the crude oil example above. Word of caution, you have to watch your bid/ask spreads, make sure you get firm quotes on the bid/ask, match them up to your other desks and always use price orders. On the horizon, I see short covering and potential net new long positions entering in energy stocks. Yes, the charts still look ugly. If you want to be less aggressive, wait for the turn (change in trend) using something as simple as a Bollinger 20,2 and exponential moving average 9 on weekly data in the examples below. Exxon Mobil Corporation (NYSE: XOM ) BP p.l.c. (NYSE: BP ) Royal Dutch Shell plc (NYSE: RDS.A ) Chevron Corporation (NYSE: CVX ) Valero Energy Corporation (NYSE: VLO ) (no short on this) Petrobras – Petroleo Brasileiro S.A. (NYSE: PBR ) Marathon Petroleum Corp. (NYSE: MPC ) (no short on this) ConocoPhillips (NYSE: COP ) Suncor Energy, Inc. (NYSE: SU ) Total S.A. (NYSE: TOT ) Statoil ASA (NYSE: STO ) Yes, oil is inexpensive and appears to be moving lower, but the world still needs it. We will eventually find a bottom, might as well get paid on our short positions while we wait.

Big Oil Portfolio – Reviewing It After The Recent Lows

Summary Like all other oil investments, the Big Oil Portfolio has taken a significant hit over the past few months. The fundamentals of none of the portfolios in the company has changed, instead, the only that has changed has been oil prices. The portfolio has a large amount of cash at hand should future opportunities present themselves. Introduction I have not provided an update for my Big Oil Portfolio since July . However, over the past few weeks, oil (NYSEARCA: USO ) has taken a significant hit dropping down to recent lows of less than $40 per barrel. The goal of this article is to take another look at the Big Oil Portfolio since the last update. Last Five Year Oil Prices – Bloomberg Oil prices remained relatively constant from 2011 – 2014. However, since reaching a peak, oil prices took a major hit dropping down to a bottom in January 2015. Oil prices bounced back up and then dropped back down forming a double bottom in March 2015 before recovering to around $60. In recent weeks, two majors things have weighed down on the market. The first was slowing economic growth in China, a major economic producer. The second was fears of a nuclear deal being signed with Iran which would result in a significant market glut. This resulted in another drop down in oil prices down to less than $40 per barrel followed by a recent small recovery. Goal The Big Oil Portfolio was originally created during a period of higher oil prices with the stated goal of building a strong portfolio for a recovery in oil prices. The goal of the article was to take a hypothetical person with $100,000 to invest in oil stocks. In this case, we will assume that you want to invest in large oil companies that are financially secure and will provide investors with income for many years to come. There are several reasons to invest in financially secure large caps during such a crash. However, the biggest one are the two words, ‘financially secure’. Should the oil crash last for longer than expected or get worse than expected, these companies will be able to last significantly longer than the competition. Portfolio Name Number of Share Purchase Price Current Price ExxonMobil (NYSE: XOM ) 150 $86.87 $72.48 Chevron (NYSE: CVX ) 200 $106.62 $76.62 Royal Dutch Shell (NYSE: RDS.A ) 100 $62.16 $49.51 ConocoPhillips (NYSE: COP ) 100 $65.62 $47.19 Schlumberger Limited (NYSE: SLB ) 100 $92.69 $74.96 Phillips 66 (NYSE: PSX ) 100 $80.99 $77.20 Total S.A. (NYSE: TOT ) 430 $52.80 $44.11 Total Amount Invested: $99,894.50 Approximate Dividend Received: $971.00 Annual Dividend Income: $3884.95 Portfolio Cash: $14,578.45 Portfolio Discussion For those who are new to the realm of cyclical business, especially ones like oil where an oversupply of a few percent can cause a 50% drop in price, numbers like those seen above can be quite scary. However, it is worth pointing out that the numbers seen above solely exist because of the change in the price of oil. In fact, with the exception of the drop in oil prices, which has fallen approximately 20% since the last article, the fundamentals of none of the other companies has changed. In fact, the only thing that has changed fundamentally in the portfolio since the original article was the decision to sell Apache Corporation (NYSE: APA ). Apache Corporation is a strong corporation with solid potential, however, the thing I disliked about it is the fact that the majority of its assets are located in the United States. The goal of the portfolio is to form a broad portfolio of stable oil companies with exposure to a number of areas and Apache Corporation did not fit within that mandate. Purchases Now that we have discussed the changes in the portfolio, the portfolio now has $14,578.45 in cash sitting around. Recent factors have combined to make the perfect storm of oil prices. SSE Index Crash – Thomson Reuters The above image shows the Chinese SSE stock index. Partially due to a slowing economic growth rate and partially due to fear of a bubble, the Chinese stock index peaked around June before dropping sharply. As a major consumer of oil, fear of a decreasing Chinese growth rate has also hurt oil prices. This has been combined with recent ideas of a potential nuclear deal between the United States and Iran. Should Iran bring its production back online, that could result in a huge amount of new production that could cause a significant oil surplus. This money will be used to purchase 252 shares of the Lehman Aggregate Bond Fund (NYSEARCA: LAG ). The Lehman Aggregate Bond Fund invests in safe bonds with a modest dividend paid on a monthly basis. More so, the fund maintains a relatively solid price and remains a solid holding of cash for potential future purchasing opportunities. Future Market Situation Now that we have talked about the portfolio’s goals along with its holdings and discussed the portfolio along with its purchases, it is now time to talk about the true driver of this portfolio. The future market situation. Because in the end, it’s really oil prices that move this portfolio around. Annual Change in U.S. Crude Production – EIA The above image shows the change in U.S. crude production. Since 2008, as a result of growing shale production, American production has been steadily increasing. This surplus is what led to the current oil crash. However, in recent weeks, U.S. oil production has been steadily decreasing. The spending cuts are finally starting to have an affect and production is starting to decrease. This is starting to solve the overall oil supply. I expect the recent lows in oil production to potentially be tested again but I would be surprised if prices fall any distance below that. Production has started slowing down while demand, driven partly by lower prices, has continued increasing. This should help cause a recovery in oil prices. Conclusion The Big Oil Portfolio is made of a number of strong oil majors several of which have a long record of paying dividends. These companies have a strong dividend that they will be able to continue paying despite the recent slump in oil prices. However, decreasing economic growth in China coupled with the potential of higher oil production from Iran has caused oil prices to take a significant hit these past weeks which has also affected the portfolio. The portfolio does however have a good amount of cash in reserve should an opportunity present itself. This cash along with dividend growth should help support a recovery in the portfolio when prices eventually recover. Disclosure: I/we have no positions in any stocks mentioned, and no plans to initiate any positions within the next 72 hours. (More…) I wrote this article myself, and it expresses my own opinions. I am not receiving compensation for it (other than from Seeking Alpha). I have no business relationship with any company whose stock is mentioned in this article.

XLE: Diversified Exposure For An Oil Rally

Summary For those who believe the oil market is going to rally, an Energy Sector ETF can provide diversified exposure. I will compare to XLE to two viable alternatives. Broad energy market ETFs reduce single stock and sub-sector risk by providing up, down, and mid stream energy exposure. Introduction I am an ETF believer. I think ETFs reduce cognitive bias and risk. I believe they provide adequate exposure and diversification when utilized properly. Each ETF comes with different equity weightings, expense, volume, yield, correlation, etc., so I have spent time recently comparing key metrics to narrow down the vast number of ETFs on the market. Crude Oil has recently tanked into the mid to low 40s, and some investors believe now is the time to capitalize on a cheap energy market. For those interested in buying into oil and gas, I recommend you avoid risky ETNs like UWTI and UGAZ . Instead, I recommend buying a less risky long-term position in a broad market energy ETF. ETNs and Unnecessary Risk Certain leveraged ETNs provide direct exposure to the oil market; however, I believe some are unnecessarily risky. In this case, a largely traded ETN like the VelocityShares 3X Long Crude Oil ETN (NYSEARCA: UWTI ) would provide an attractive amount of liquidity based on its high trading volume. However, this type of fund is associated with a veritable laundry list of risks including tracking error, compounding risk, and expensive fees. These funds perform sub optimally in flat or declining environments, and they generally decline significantly over time. For more information on the risks of multiplied leverage and daily tracking risk see my article here . To help visualize the sharp decline, I’ll include a relevant graph. Other more conservative options include 1X ETNs that don’t suffer from the same long-term tracking error as a 3X ETN. (2X and 3X ETNs in particular are meant to be used by professionals to accomplish short term objectives.) An example of a direct investment in the oil market includes the United States Oil Fund ETF (NYSEARCA: USO ). In theory, USO would provide a much stronger correlation to the underlying oil market. However, I believe strongly that an ETF designed towards broad market exposure will outperform the underlying oil market. While the 1X ETN has a better correlation, and ETF is not limited strictly by the change in the underlying index (oil price). A well-crafted, highly liquid energy ETF, provides additional incentives such as dividends, and it achieves returns based on the weighted performance of its portfolio holdings. An ETN designed to track an index is limited to the fluctuations of the price of the underlying commodity. A sector ETF on the other hand is based on the growth capabilities and stock performance of its energy holdings. It is clear that XLE is more capable of mitigating its downside in a weak environment whilst maximizing returns in a bull market. I believe companies are able to develop strategies that allow for protection from fluctuations in price. An Oil Rally With Brent at 49.15 and WTI at 42.50, some believe the oil market has been dramatically oversold. The argument for an oil rally is essentially this: overly negative sentiment towards a supply gut and geopolitical events (like the Iran deal) has led to an unprecedented market sell off that has driven oil prices to six year lows. Now is the time to capitalize on cheap oil. We are currently in an environment similar to early March, and oil will return to prices closer to 55-60 dollars a barrel (WTI). If you hold to this belief, I recommend choosing an energy ETF that will perform optimally in a variety of environments. The integrated broad market exposure will allow the investor to reduce the risk of betting solely on the performance of the underlying commodity ((oil)). XLE & Two Alternatives Currently I am invested in the Energy Select Sector SPDR ETF (NYSEARCA: XLE ), and I will make the case for XLE in this article. In an effort to provide you with additional high quality options, I will also analyze the Vanguard Energy ETF (NYSEARCA: VDE ) and the iShares U.S. Energy ETF (NYSEARCA: IYE ). There are other energy plays. Some ETFs focus specifically on the E&P side while others have more exposure to global performance. I liked XLE, VDE, and IYE because they are more focused on North American Companies (Exxon (NYSE: XOM ), Chevron (NYSE: CVX ), Etc.) with a global presence in all aspects of the energy market. These ETFs are also have the largest amount of net assets and provide desirable liquidity. Correlation I always mention correlation because you want the ETF to closely track (if not outperform) the underlying index. If it does not do this, then the ETF is likely inefficiently weighted. With long plays, short term correlation is less important, but I will include a graph to show how each ETF performs relative to its index. ^SS1J data by YCharts I compared each ETF to the S&P 500 Equal Weighted Energy Sector Level % change. it is not a perfect correlation, but it does express the close relative grouping of each. Really all I’m looking for here is that each ETF does what it says it will do. Looking closer into 5-year returns, you’ll notice XLE outperformed both VDE and IYE by about 3.5%. Brief Portfolio Composition Look Each ETF is weighted towards each subsector of the broad energy market differently. For this reason, there is variety of tracking error and diversification differentiation. I made an excel sheet to express each sub-sector weighting. Portfolio Composition XLE VDE IYE Integrated Oil and Gas 32% 32% 34% E&P 29% 30% 31% Equipment & Service 17% 16% 17% Pipelines 10% 11% 7% Refiners 10% 8% 7% Drillers, Coal, Etc. 1% 2% 3% Key ETF Metrics I included some key metrics to make a valid comparison. While it does not necessarily dive into weighting or historical returns, it does help narrow down specific areas to think about. XLE VDE IYE Total Assets 11.28 Bil 3.68 Bil 1.19 Bil Avg. Volume 19.9 Mil 456,395 1.1 Mil Expense 0.15% 0.12% 0.45% SEC Yield 2.93% 3.01% 2.28% Turnover Ratio 5.25% 4.00% 7.00% Recommendation All three ETFs are tactical plays that offer exposure to the U.S. energy sector without taking on too much single equity risk. Historically XLE has performed the strongest in most market conditions. I attribute this to XLE’s large net assets and broad exposure (particularly downstream: refiners, pipelines etc.) Storage and Pipelines are not as hurt by excess supply because price reductions are mitigated by increased service demand. XLE has desirable liquidity, and it is extremely cheap (15 Basis points) with a near 3% yield. I believe XLE is the best energy ETF on the market. Disclosure: I am/we are long XLE. (More…) I wrote this article myself, and it expresses my own opinions. I am not receiving compensation for it (other than from Seeking Alpha). I have no business relationship with any company whose stock is mentioned in this article.