Tag Archives: xhr-cb-time

Couch Potato Model Portfolios For 2015

Call off the hounds: I have finally updated my model Couch Potato portfolios for 2015. Full details appear on the permanent Model Portfolios page , but here are the new versions in downloadable PDF format: You’ll notice some significant changes this year: I have dropped the Complete Couch Potato and Über-Tuber from the lineup. All of the model portfolios now include only traditional index funds tracking the major asset classes: no REITs, real-return bonds, value stocks or small-cap stocks. The new lineup presents three options, with the key difference being the type of product. Option 1, from Tangerine , is a one-fund solution that’s ideal for investors who value simplicity. Option 2, the TD e-Series funds , offers more flexibility and lower cost. Option 3, built from Vanguard ETFs , is the cheapest option, but also the most difficult to manage for new investors. None of the options include ETFs traded on U.S. exchanges. Each option now includes several different asset allocations, ranging from a conservative (70% bonds and 30% stocks) to a aggressive (10% bonds and 90% stocks). The older model portfolios were all 40% bonds and 60% stocks, the traditional mix in a balanced portfolio. For each option and asset mix, we present performance data going back 20 years (1995 through 2014), compiled by Justin Bender . Since none of the funds has a track record that long, we have filled in the gaps using index data minus the MER of the fund in question. This is an imperfect but reasonable proxy for how an index fund would have performed. I thought long and hard about these changes, because I know many readers currently use one of the older model ETF portfolios. But it has now been more than five years since I launched this blog, and I have corresponded with hundreds of investors during that time. I’ve also worked directly with dozens more through PWL Capital’s DIY Investor Service . That depth of experience has given me a few insights. First, simple is usually better than complex. You can now build a portfolio that includes hundreds of bonds and thousands of stocks in some 40 countries using just three ETFs, all for a cost of less than 0.20%. No one needs to diversify more broadly than that. A skilled portfolio manager may be able to boost returns slightly by moving beyond traditional index funds in the core asset classes. But many DIYers make costly mistakes when they try to juggle too many funds. Meanwhile, there are exactly zero investors in the universe who failed to meet their financial goals because they did not hold global REITs or small-cap value stocks. Using U.S.-listed ETFs is a another example: the management fees and withholding taxes may be lower, but the steps involved in currency conversion can be complicated and it’s easy to make errors that wipe out any potential savings. If you don’t believe me, try explaining Norbert’s gambit to your mom. These model portfolios are not intended to reduce MERs and taxes to an absolute minimum. The suggested asset allocations were not created using Markowitz’s efficient frontier or portfolio optimization software. They are simply designed to provide broad diversification and low cost while remaining easy to manage on your own. So try not to agonize over the small details: just choose one of the model portfolios with an appropriate amount of risk and get started. It’s OK if convenience trumps cost, especially for young investors with small portfolios: remember, an additional cost of 0.10% works out to $0.83 a month for every $10,000 in your account. The cost of sitting in cash and scratching your head is much higher. And the peace of mind that comes with a simple investing strategy is priceless. Now that you’ve read this, are you Bullish or Bearish on ? Bullish Bearish Sentiment on ( ) Thanks for sharing your thoughts. Why are you ? Submit & View Results Skip to results » Share this article with a colleague
Falling U.S. Inflation Could Drive Up SLV

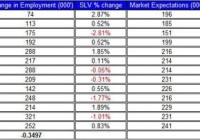
The price of SLV rallied by 5% during the year, up to date. Falling U.S. inflation may pull up SLV via the drop in U.S. treasury yields. The recent Non-farm payroll was inline with market expectations, but it didn’t drag down SLV. After losing nearly 8% during the last quarter of 2014, the iShares Silver Trust ETF (NYSEARCA: SLV ) showed some signs of recovery as its price added over 5% during this month. Even the strong results from the last non-farm payroll report didn’t curb down the price of SLV from picking up. Let’s review the relation among the developments in the U.S. labor market, inflation and the progress of SLV. The non-farm payroll report was published on Friday. It showed a 252 thousand of jobs added during December. Moreover, the previous two months were revised up by 50 thousand jobs. The rate of unemployment slipped to 5.6%. The table below shows the changes in SLV and the non-farm payroll results in 2014. Source of data taken from Bureau of Labor Statistics As you can see, the correlation between the changes in the gap between market projections and actual figures and the price of SLV is mid-strong and negative at -0.45 – this result suggests that as long as the number of jobs added doesn’t exceed market expectations, the price of SLV is likely to rally. Despite the recent rise of SLV last week, the ongoing recovery of the U.S. labor market doesn’t play in favor of SLV. This recovery, however, still has a long way to go until the U.S. labor market shows a full recovery – mainly in wages. Based on the recent report, hourly wages grew by only 1.7% on an annual pace. This is still a low level and remains well below the levels recorded before the 2008 economic meltdown. The other major report related to the U.S. labor market is the upcoming JOLTS report, which will be published this week. (click to enlarge) Source of data taken from Bureau of Labor Statistics Albeit the price of SLV doesn’t have as strong relation to the JOLTS figures as it does with the non-farm payroll. This is still an important report that could indicate the progress of the U.S. economy. The current estimates are for the report to show a 4.91 million jobs opening. The upcoming U.S. CPI and PPI, which will be released this week, could provide another measurement about the changes of the U.S. inflation. If the U.S. core inflation continues to slowly come down, this doesn’t vote well for rise in U.S. wages. The fall in U.S. inflation, however, could actually play in favor of SLV. At the very least, it may play this year in two roles when it comes to SLV. Usually, lower inflation tends to steer away investors, who fear of a potential spike in inflation, from precious metals investments such as SLV. The chart below presents the relation between core CPI and SLV during 2013-2014. Source of data taken from Bureau of Labor Statistics and Google finance Most of the drop in U.S. inflation was stemmed, as you well know, from falling oil prices. During the past few months, the correlation between SLV and oil prices was mid-strong and positive at 0.4. Albeit the price of SLV remained relatively flat, oil prices tumbled down by more than 40% in the past three months. So why falling oil prices could actually be good for SLV? As U.S. inflation falls, this is likely to reduce the odds of the FOMC raising rates. For now, the market still expects the FOMC to raise rates by the middle of the year. Alas, if U.S. inflation does tumble down, it could eventually influence FOMC members to reevaluate their policy. Finally, falling U.S. inflation is also likely to keep down U.S. long term treasuries yields, which tend to have a negative relation with the price of SLV. Therefore, falling long term treasuries yields driven, in part, by lower inflation provide the environment needed to keep pulling up SLV. For more see: Choosing Between Gold and Silver

How Do You Look At CEF Performance?

Closed-end fund GGN’s share price has felt the hit of weak gold and oil prices. But it pays out big dividends using return of capital. That makes figuring out your return more difficult than you might imagine. Closed-end funds like GAMCO Global Gold, Natural Resources & Income Trust (NYSEMKT: GGN ) and sibling GAMCO Natural Resources, Gold & Income Trust (NYSE: GNT ), two closed-end funds, or CEFs, I have written about recently are odd beasts. They trade like a stock, but are pooled investment vehicles like open-end mutual funds. That not only leads to a disconnect between market price and net asset value, or NAV, but it also makes it harder to decide how you should judge their performance. And, in the end, beauty is in the eye of the beholder on this front. The investment world’s El Camino If you’re as old as I am, or older, you remember the Chevy El Camino. It was an unusual combination of a pickup truck flatbed and a sedan/station wagon front end. Some might call at ugly, some might call it sexy, I would say it’s so weird it’s kind of cool. But, in the end, your individual judgment is what goes for you. Closed-end funds are very similar to El Caminos. That’s not the most flattering complement, but it’s true. They are a “stock-like” front end hitched up to a pooled investment medium. It’s really an ugly stepchild in the investing world, even though CEFs offer some desirable attributes. The big one that catches people’s eye is usually income. A facet of the investment space that CEFs do much better than open-end mutual funds. However, what you get may not be what it appears to be. On the surface you are getting dividends, just like any other stock. But there’s more going on than that and it changes the whole picture. When a stock pays a dividend the money is coming from what it earns (technically it comes out of cash flow). When a closed-end fund pays a distribution (note the different term) it comes out of… the income received from the securities it owns in its portfolio, proceeds from asset sales, and for some funds income from options transactions. ( This article covers some basics on distributions and return of capital, which are beyond the scope of what I’m trying to discuss here.) That’s a big difference. For example, presumably a company that just paid a dividend still has everything in place to earn more money. That’s why stock prices generally don’t fall when a dividend is paid even though the company is, technically, worth less since it just gave its shareholders a chunk of its bank account. The market’s assumption is that it can repeat the process because it’s an ongoing business. A pooled investment vehicle’s value is just the assets it owns, which are all securities. It doesn’t own machinery or patents or stores. When a mutual fund, closed-end or open-end, pays a distribution its value goes down because it just gave away part of what gave it value in the first place. Indeed, net asset value, or NAV, is just the fund’s assets divided by its share count. Give away some of those assets and the NAV has to go down. Performance So when you get a distribution from a closed-end fund how should you think about it? To be fair, it’s a part of your total return. For example, Morningstar’s trailing five-year return for GGN through year-end 2014 is about -5.5% annualized. But a quick look at a graph of GGN’s share price over that time period tells you that it was down nearly 60%. Those two numbers don’t jive. That’s because Morningstar is calculating performance as if the distributions were reinvested. It’s the same way open-end mutual funds are handled. It is, technically, the correct way to look at a closed-end fund’s performance. It’s a pooled investment vehicle, not a stock. But if you are buying a closed-end fund for income, you aren’t likely to be reinvesting those distributions. You are probably living off of them. That means you likely don’t think about performance as a mater of total return (which adds distributions to share price changes). You look at the CEF’s price as the value of what you own and distribution as income you receive, and don’t mix the two. Looked at in that way, GGN is a lousy investment-it’s down 60%! Looked at via total return, reinvesting the distributions, however, it really hasn’t been a bad performer. For example, the Vanguard Precious Metals And Mining Fund (MUTF: VGPMX ) posted an annualized loss of about -11.5% over the trailing five year period though the end of last year. That makes an annualized loss of -5.5% look much better. But that won’t matter to you if your frame of mind is to look at this investment El Camino in a different way. Beauty is in the eye of the beholder I like closed-end funds for the income they offer. They are an easy way to get professional management and income, but they aren’t perfect and they aren’t right for everyone. If you want a long-term investment that appreciates in value and pays you a large dividend, you are probably better off investing directly in stocks. Not too many closed-end funds pull that combination off. If you can get your head around total return as your benchmark, then CEFs can work for you as long-term holdings. That said, there are other ways to look at investing in CEFs. For example, trying to capture a shrinking discount when that discount gets unusually wide for some reason. That, in the end, is the play I’ve highlighted with both GGN and GNT. However, even this doesn’t change the need to get a handle on how you want to look at CEF performance and what that means for your investment approach.