Tag Archives: xhr-cb-time

Should I Have High Yield (Junk) Bonds In My Portfolio?

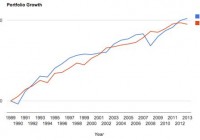
Summary By buying junk bonds I would take on more risk. The trade off is I would expect better returns. Do high yield junk bonds belong in my portfolio? Junk Bond Risks Companies that have low credit ratings pay higher interest rates, but of course those rates come with higher risk of default. Below we show data from Fitch that shows historical default rates. Non-investment grade (junk) rating consists of data rated BB and below. As can be seen default rates rise quickly as rating grades get worse. Fitch Global Corporate Finance Average Cumulative Default Rates: 1990-2013 1 year 2 year 3 year 4 year 5 year 10 year AAA 0 0 0 0 0 0 AA 0.03 0.03 0.07 0.13 0.19 0.24 A 0.08 0.22 0.38 0.52 0.71 1.82 BBB 0.19 0.66 1.19 1.76 2.36 4.64 BB 1.09 2.68 4.27 5.71 6.95 10.94 B 1.94 4.54 6.87 9.01 10.88 11.44 CCC to C 23.51 31.48 34.96 37.01 39.58 39.54 Investment Grade 0.11 0.35 0.61 0.88 1.17 2.27 Speculative Grade 2.88 5.33 7.38 9.16 10.70 13.38 All Corporate Finance .73 1.43 2.04 2.59 3.07 4.07 It is wise to keep in mind that during severe market corrections ratings tend to get downgraded and default rates increase. Fitch-Rated Global Corporate Finance Issuer Default Rates Default Rates 1990-2013 Year Default Rate (%) 1990 1.36 1991 2.25 1992 0.65 1993 0.00 1994 0.00 1995 0.11 1996 0.29 1997 0.08 1998 0.42 1999 0.85 2000 0.38 2001 0.90 2002 2.17 2003 1.16 2004 0.12 2005 0.32 2006 0.07 2007 0.10 2008 1.28 2009 2.58 2010 0.49 2011 0.30 2012 0.65 2013 0.51 As we can see above during both the Tech Wreck and the Great Recession defaults increased substantially. Junk Bond Returns compared to 5 Year Treasuries Portfolio Visualizer provides some excellent tools for backtesting. I used their tools to generate a backtest for comparing High Yield Bonds to 5 Year Treasuries. Portfolio 1 – High Yield Bonds – As represented by Vanguard High Yield Corporate (MUTF: VWEHX ) Portfolio 2 – Five Year Treasuries (click to enlarge) (click to enlarge) As shown about High Yield bonds did return slightly more, but had a much larger maximum drawdown and worse risk adjusted returns based on the Sharpe Ratio and the Sortino Ratio. (click to enlarge) The year -by- year comparison shows that treasuries performed well when the equity market was correcting while High Yield bonds performed poorly. Conclusions Junk Bonds had a slightly higher CAGR over the 1990-2013 time frame, but the advantage was small 7.11% to 6.59% and Junk Bonds actually trailed the treasuries from 1990-2011. Was the small advantage in CAGR worth the risk? The maximum drawdown for the junk bonds was -21.29% the max drawdown for the Treasuries was -4.33%. Junk bonds had a Sharp Ratios of 0.41 and Sortino Ratio of 0.75 compared to a Sharpe Ratio of 0.59 and a Sortino Ratio of 1.40 for the treasuries. I’m semi-retired and bonds are the low-risk part of my portfolio. The possibility of a 20% plus drawdown in the ‘safe’ part of my portfolio makes be lean toward selecting the treasuries. When you add in the fact that the high-yield bonds barely beat the treasuries in total returns it’s a no-brainer. Not only did junk bonds have larger drawdowns they had them at the worst possible time. When equities were taking a beating in 2008 High Yield bonds were going right down with them: -21.29%. Treasuries were up 13.32% in 2008; this is exactly the kind of negative correlation I want my bond holding to display during an equity market correction. Junk bonds have taken a hit lately and the spread between high yield and investment grade bonds has widened. Some investors may view this as an opportunity. I still do not view the risk/reward favorably. If I need higher returns I would be inclined to add more equities and keep my bond investments in Treasuries or investment grade corporate bonds. Bonds are in my portfolio to provide safety, smoothing out my returns and keeping me from having to sell losing investments during a correction. Junk Bonds don’t fit the bill. I won’t be adding junk to my portfolio. I am not a professional advisor or researcher. I am an individual investor who studies investing and shares my thoughts. I encourage all investors to do their own due diligence and please share your findings. I strongly feel the best thing about Seeking Alpha is the sharing of ideas. Please comment; I value your input. Divergent opinions are welcome.

Utilities: The High-Flyers Of 2014

The S&P 500 Utilities sector is closing out 2014 with a bang. As shown below, the sector is currently in the midst of another big momentum move higher into extreme overbought territory – currently trading more than two standard deviations above its 50-day moving average. The sector is up a whopping 28% year-to-date – easily the top performing sector of 2014. No wonder so many portfolio managers are underperforming this year. Utilities – the most defensive, low-growth sector of the market – has been leading the way. It’s tough to sell investors on a big overweight position in utilities, especially in a rising rate (at least those are the expectations) environment. But if you haven’t owned utilities, chances are you’ve lost ground to the S&P this year. After this recent move into the stratosphere, the P/E ratio for the utilities sector has jumped up to 18.77. That’s high, especially in relation to the P/E ratio of the S&P 500 as a whole. At 18.77, the P/E for utilities is actually 0.27 points higher than the P/E for the S&P 500 (18.50). Now that you’ve read this, are you Bullish or Bearish on ? Bullish Bearish Sentiment on ( ) Thanks for sharing your thoughts. Why are you ? Submit & View Results Skip to results » Share this article with a colleague

4 Outperforming Country ETFs Of 2014

Amid a myriad of economic and political woes, the stock markets across the globe have given mixed performances. While 2014 is turning out as another banner year for the U.S. stock market with multiple record highs on several occasions, international investing has not been so encouraging. This is especially true as Vanguard FTSE All-World ex-US ETF (NYSEARCA: VEU ) targeting the international equity market has lost about 4% this year compared to a gain of 5.3% for iShares MSCI ACWI ETF (NASDAQ: ACWI ) , which targets the global stock market including the U.S. A strong dollar, Russia turmoil, slump in key emerging markets, sliding oil prices, speculation of interest rates hike faster than expected, and concerns over the global slowdown continued to weigh on the international stocks. Though developed markets started the year on a solid note, these lost momentum with Europe struggling to boost growth and inflation, and Japan suffering from the biggest setback following a sales tax increase in April that has pushed the world’s third-largest economy into a deep recession. Among developing nations, Russia has been hit hard owing to Western sanctions and a massive drop in oil prices while Greece saw another political chaos. On the other hand, India and Indonesia have shown strong resilience to the global slowdown driven by positive developments, election euphoria, new reforms and monetary easing policies. In particular, Chinese stocks have no doubt given impressive performances with the Shanghai Composite Index touching the major threshold of 3,000 for the first time in three years. The massive gains came on the back of speculation that the loose monetary policy measures will revive the dwindling economy and pump billions of dollars into the country. Additionally, growing investor confidence following prospects of a rebound in the Chinese economy, a stabilizing real estate market as well as the launch of the Shanghai-Hong Kong Stock Connect program propelled the Chinese stocks higher in recent months. There are several country ETFs that not only delivered handsome returns this year but also crushed the broad U.S. market fund. Below, we have highlighted a few of these strong momentum plays, which could be interesting picks for investors heading into the New Year. iShares MSCI India Small Cap Index Fund (BATS: SMIN ) – Up 48.3% This product provides exposure to the small cap segment of the broad Indian stock market by tracking the MSCI India Small Cap Index. Holding 180 securities in its basket, it is widely spread out across number of securities with none holding more than 2.67% of assets. Financials takes the top spot with one-fourth share followed by consumer discretionary (19.8%), industrial (18.4%) and materials (10.2%). The fund has been able to manage assets worth $24.1 million while sees light volume of about 16,000 shares per day. Expense ratio came in at 0.74%. SMIN is up over 48% this year and has a Zacks ETF Rank of 2 or ‘Buy’ rating with a High risk outlook. PowerShares China A-Share Portfolio (NYSEARCA: CHNA ) – Up 43.18% This is an actively managed ETF providing exposure to the China A-Share market using Singapore exchange FTSE China A50 Index futures contracts. The product is unpopular and illiquid with AUM of $5.3 million and average daily volume of around 8,000 shares. It charges 51 bps in fees per year from investors and has surged about 43% this year. iShares MSCI Philippines Investable Market Index (NYSEARCA: EPHE ) – Up 22.4% This product targets the Philippines stocks in the emerging Asia Pacific space and tracks the MSCI Philippines Investable Market Index. The fund has amassed $365.3 million in its asset base while trades a good volume of 236,000 shares a day. It charges 61 bps in annual fees. The fund holds a small basket of 43 firms with 61.5% of assets invested in the top 10 holdings, suggesting a high concentration risk. More than one-third of the portfolio is dominated by financials while industrials occupy the second position with 22.4% share. The fund has added over 22% this year and has a Zacks ETF Rank of 3 or ‘Hold rating with a Medium risk outlook. iShares MSCI Indonesia Investable Market Index Fund (NYSEARCA: EIDO ) – Up 20.76% This fund provides exposure to the Indonesian equity market by tracking the MSCI Indonesia Investable Market Index. Holding 102 securities in its basket, it is concentrated on both sectors and securities. The product puts about 44% in the top five holdings while financials dominates the fund’s return at 37.1%. EIDO is the most popular ETF with AUM of $578.4 million and average daily volume of nearly 665,000 shares. Expense ratio came in at 0.61%. The fund is up 20.8% so far in the year and has a Zacks ETF Rank of 2 with a High risk outlook. Bottom Line Investors should note that some specific emerging market ETFs have outperformed this year and will likely continue this trend in 2015. This is especially true, as a slump in oil price has created a major headwind for many key emerging nations or oil producing nations. Also, some developed economies are facing problems in reinvigorating growth.