Tag Archives: worst

Best And Worst Q3’15: Large Cap Growth ETFs, Mutual Funds And Key Holdings

Summary The Large Cap Growth Style ranks fourth in Q3’15. Based on an aggregation of ratings of 24 ETFs and 622 mutual funds. QUAL is our top-rated Large Cap Growth ETF and FLGEX is our top-rated Large Cap Growth mutual fund. The Large Cap Growth style ranks fourth out of the 12 fund styles as detailed in our Q3’15 Style Ratings for ETFs and Mutual Funds report. It gets our Neutral rating, which is based on an aggregation of ratings of 24 ETFs and 622 mutual funds in the Large Cap Growth style. See a recap of our Q2’15 Style Ratings here. Figures 1 and 2 show the five best and worst-rated ETFs and mutual funds in the style. Not all Large Cap Growth style ETFs and mutual funds are created the same. The number of holdings varies widely (from 21 to 683. This variation creates drastically different investment implications and, therefore, ratings. Investors seeking exposure to the Large Cap Growth style should buy one of the Attractive-or-better rated ETFs or mutual funds from Figures 1 and 2. Figure 1: ETFs with the Best & Worst Ratings – Top 5 (click to enlarge) * Best ETFs exclude ETFs with TNAs less than $100 million for inadequate liquidity. Sources: New Constructs, LLC and company filings The State Street Systematic Growth Equity ETF (NYSEARCA: SYG ) and the Direxion iBillionaire Index ETF (NYSEARCA: IBLN ) were excluded from Figure 1 because its total net assets are below $100 million and do not meet our liquidity minimums. Figure 2: Mutual Funds with the Best & Worst Ratings – Top 5 (click to enlarge) * Best mutual funds exclude funds with TNAs less than $100 million for inadequate liquidity. Sources: New Constructs, LLC and company filings The iShares MSCI USA Quality Factor ETF (NYSEARCA: QUAL ) is the top-rated Large Cap Growth ETF and the Fidelity Large Cap Growth Enhanced Index Fund (MUTF: FLGEX ) is the top-rated Large Cap Growth mutual fund. Both earn a Very Attractive rating. The Columbia Select Large Cap Growth ETF (NYSEARCA: RWG ) is the worst-rated Large Cap Growth ETF and the Quaker Strategic Growth Fund (MUTF: QUAGX ) is the worst-rated Large Cap Growth mutual fund. RWG earns a Neutral rating and QUAGX earns a Very Dangerous rating. Verizon Communications, Inc. (NYSE: VZ ) is one of our favorite stocks held by Large Cap Growth funds and earns our Attractive rating. Since 2006, Verizon has grown after-tax profit ( NOPAT ) by 6% compounded annually. When including Verizon’s quarterly results this year, NOPAT is up an additional 8% on a trailing-twelve month basis. Verizon currently earns a return on invested capital ( ROIC ) of 8% and has increased its NOPAT margin to 16% from 13% in 2006. The market is not giving Verizon the credit it deserves for its consistent business operations, and the stock is undervalued. At its current price of $47/share, Verizon has a price to economic book value ( PEBV ) ratio of 0.8. This ratio implies that the market expects Verizon’s profits to decline permanently by 20%. If Verizon can grow NOPAT by 4% compounded annually for the next five years , the stock is worth $73/share – a 55% upside. Adobe Systems, Inc. (NASDAQ: ADBE ) is one of our least favorite stocks held by Large Cap Growth funds and earns our Dangerous rating. The company’s NOPAT has fallen by 28% compounded annually since 2011 and coincides with NOPAT margin falling to 10% from 29% over the same time frame. Adobe currently earns a 6% ROIC which is just a third of the 18% earned in 2011. However, the stock remains overvalued and does not reflect the company’s recent profit struggles. To justify the current price of ~$85/share, Adobe must grow NOPAT by 22% compounded annually for the next 20 years . Adobe has definitely seen better days, owning the stock and betting on such high growth for another two decades seems unrealistic. Figures 3 and 4 show the rating landscape of all Large Cap Growth ETFs and mutual funds. Figure 3: Separating the Best ETFs From the Worst Funds (click to enlarge) Sources: New Constructs, LLC and company filings Figure 4: Separating the Best Mutual Funds From the Worst Funds (click to enlarge) Sources: New Constructs, LLC and company filings D isclosure: David Trainer and Max Lee receive no compensation to write about any specific stock, style, style or theme. Disclosure: I/we have no positions in any stocks mentioned, and no plans to initiate any positions within the next 72 hours. (More…) I wrote this article myself, and it expresses my own opinions. I am not receiving compensation for it. I have no business relationship with any company whose stock is mentioned in this article.
Best And Worst Q3’15: Large Cap Blend ETFs, Mutual Funds And Key Holdings

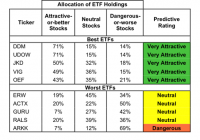
Summary Large Cap Blend style ranks second in Q3’15. Based on an aggregation of ratings of 56 ETFs and 848 mutual funds. DDM is our top-rated Large Cap Blend ETF and CMIIX is our top-rated Large Cap Blend mutual fund. The Large Cap Blend style ranks second out of the 12 fund styles as detailed in our Q3’15 Style Ratings for ETFs and Mutual Funds report. It gets our Attractive rating, which is based on an aggregation of ratings of 56 ETFs and 848 mutual funds in the Large Cap Blend style. See a recap of our Q2’15 Style Ratings here. Figures 1 and 2 show the five best and worst-rated ETFs and mutual funds in the style. Not all Large Cap Blend style ETFs and mutual funds are created the same. The number of holdings varies widely (from 18 to 1334). This variation creates drastically different investment implications and, therefore, ratings. Investors seeking exposure to the Large Cap Blend style should buy one of the Attractive-or-better rated ETFs or mutual funds from Figures 1 and 2. Figure 1: ETFs with the Best & Worst Ratings – Top 5 (click to enlarge) * Best ETFs exclude ETFs with TNAs less than $100 million for inadequate liquidity. Sources: New Constructs, LLC and company filings The Arrow QVM Equity Factor ETF (NYSEARCA: QVM ) is excluded from Figure 1 because its total net assets are below $100 million and do not meet our liquidity minimums. Figure 2: Mutual Funds with the Best & Worst Ratings – Top 5 (click to enlarge) * Best mutual funds exclude funds with TNAs less than $100 million for inadequate liquidity. Sources: New Constructs, LLC and company filings The ProShares Ultra Dow 30 ETF (NYSEARCA: DDM ) is the top-rated Large Cap Blend ETF and the Calvert Large Cap Core Portfolio (MUTF: CMIIX ) is the top-rated Large Cap Blend mutual fund. Both earn our Very Attractive rating. The Ark Innovation ETF (NYSEARCA: ARKK ) is the worst-rated Large Cap Blend ETF and the Virtus Equity Trend Fund (MUTF: VAPAX ) is the worst-rated Large Cap Blend mutual fund. ARKK earns our Dangerous rating and VAPAX earns our Very Dangerous rating. Qualcomm (NASDAQ: QCOM ), is one of our favorite stocks held by Large Cap Blend funds and earns our Very Attractive rating. Since 2010, Qualcomm has grown after-tax profit ( NOPAT ) by an impressive 29% compounded annually. Over this same time frame, Qualcomm’s already top quintile return on invested capital ( ROIC ) has improved from 31% to 54%. In addition, Qualcomm’s NOPAT margin has increased from 23% to 26%. Qualcomm is becoming more efficient and profitable but the stock does not reflect these advancements. At its current price of $62/share, Qualcomm has a price to economic book value ( PEBV ) ratio of 0.8. This ratio implies that the market expects Qualcomm’s NOPAT to permanently decline by 20% from current levels. If Qualcomm can grow NOPAT by just 4% compounded annually over the next five years , the stock is worth $87/share ­- a 40% upside. Amazon.com (NASDAQ: AMZN ) is one of our least favorite stocks held by Large Cap Blend funds and earns our Dangerous rating. Since peaking in 2010, Amazon’s NOPAT has declined by 28% compounded annually. Its ROIC has fallen from 31% to a bottom quintile 2% over the same time frame. We’ve previously written on Amazon’s free cash flow issues , which have only worsened as Amazon had -$7 billion in free cash flow in 2014. Despite the issues, bulls continue to propel AMZN higher, and it is up 47% year to date, which leaves it significantly overvalued. To justify its current price of $535, Amazon must grow NOPAT by 28% compounded annually over the next 23 years . This scenario also assumes Amazon is able to maintain its pre-tax (NOPBT) margin at 1%, a level it has not been able to maintain in recent years. We think the expectations embedded in AMZN are out of touch with reality. Figures 3 and 4 show the rating landscape of all Large Cap Blend ETFs and mutual funds. Figure 3: Separating the Best ETFs From the Worst Funds (click to enlarge) Sources: New Constructs, LLC and company filings Figure 4: Separating the Best Mutual Funds From the Worst Funds (click to enlarge) Sources: New Constructs, LLC and company filings D isclosure: David Trainer and Kyle Guske II receive no compensation to write about any specific stock, style, style or theme. Disclosure: I/we have no positions in any stocks mentioned, and no plans to initiate any positions within the next 72 hours. (More…) I wrote this article myself, and it expresses my own opinions. I am not receiving compensation for it. I have no business relationship with any company whose stock is mentioned in this article.

Best And Worst Q3’15: All Cap Value ETFs, Mutual Funds And Key Holdings

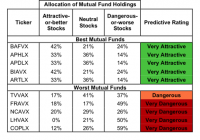
Summary All Cap Value style ranks fifth in Q3’15. Based on an aggregation of ratings of 0 ETFs and 257 mutual funds. BAFVX is our top-rated All Cap Value mutual fund and COPLX is our worst-rated All Cap Value mutual fund. The All Cap Value style ranks fifth out of the twelve fund styles as detailed in our Q3’15 Style Ratings for ETFs and Mutual Funds report. It gets our Neutral rating, which is based on aggregation of ratings of 0 ETFs (no All Cap Value ETFs are currently under coverage) and 257 mutual funds in the All Cap Value style. See a recap of our Q2’15 Style Ratings here. Figure 1 shows the five best and worst rated All Cap Value mutual funds. Not all All Cap Value style mutual funds are created the same. The number of holdings varies widely (from 21 to 521). This variation creates drastically different investment implications and, therefore, ratings. Investors seeking exposure to the All Cap Value style should buy one of the Attractive-or-better rated ETFs or mutual funds from Figure 1. Figure 1: Mutual Funds with the Best & Worst Ratings – Top 5 (click to enlarge) * Best mutual funds exclude funds with TNAs less than $100 million for inadequate liquidity. Sources: New Constructs, LLC and company filings LSV U.S. Managed Volatility Fund (MUTF: LSVMX ) (MUTF: LVAMX ) is excluded from Figure 2 because its total net assets are below $100 million and do not meet our liquidity minimums. The Brown Advisory Value Equity Fund (MUTF: BAFVX ) is the top-rated All Cap Value mutual fund and earns a Very Attractive rating. The Copley Fund (MUTF: COPLX ) is the worst-rated All Cap Value mutual fund and earns a Very Dangerous rating. Oracle Corporation (NYSE: ORCL ) is one of our favorite stocks held by All Cap Value funds and earns our Attractive rating. Over the past decade, the company has grown after-tax profit ( NOPAT ) by 15% compounded annually. Oracle currently earns a top quintile return on invested capital ( ROIC ) of 25%. Despite one of the highest ROIC’s in the business and consistent profit growth, ORCL remains undervalued. At its current price of ~$39/share, Oracle has a price to economic book value ( PEBV ) ratio of 1.1. This ratio implies that the market expects Oracle’s profits to grow by no more than 10% over current levels for the remainder of its corporate life. If Oracle can grow NOPAT by just 5% compounded annually for the next ten years , the stock is worth $53/share – a 36% upside. Intersil (NASDAQ: ISIL ), a previous Danger Zone pick , is one of our least favorite stocks held by All Cap Value funds and earns our Very Dangerous rating. Since 2009, Intersil’s NOPAT has fallen by 31% compounded annually. The company currently earns a bottom quintile ROIC of 1% and has a NOPAT margin of only 2%. Such a low margin leaves little room for error in the highly competitive semiconductor industry. With such poor fundamentals, Intersil’s stock, despite being down 18% year to date, remains overvalued. To justify the current price of $11/share, Intersil must grow NOPAT by 30% compounded annually for the next 19 years. Betting on double digit NOPAT growth for such an extended period of time is overly risky given the past profits profile of this company. Investors should, instead, invest in quality stocks like Oracle. Figure 2 shows the rating landscape of all All Cap Value mutual funds. Figure 2: Separating the Best Mutual Funds From the Worst Funds (click to enlarge) Sources: New Constructs, LLC and company filings D isclosure: David Trainer and Max Lee receive no compensation to write about any specific stock, style, style or theme. Disclosure: I/we have no positions in any stocks mentioned, and no plans to initiate any positions within the next 72 hours. (More…) I wrote this article myself, and it expresses my own opinions. I am not receiving compensation for it. I have no business relationship with any company whose stock is mentioned in this article.