Why The S&P 500 Is A Bad Benchmark
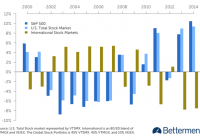
Summary The S&P 500 represents only a portion of the world’s total stock market, whereas a diversified portfolio represents all of the world’s stocks—and can better manage risk over time. Individual parts of a diversified portfolio will always beat the overall portfolio. You just don’t know which part. Are you tall? Your answer to that will likely depend on your own personal context. For example, if you’re a 5’9” American male, and you’re comparing yourself to your American male peers, then you might say no. Why? Many of your friends are likely taller than you are, given that you’re a half-inch shorter than the average American male. ¹ But what happens when you compare your height to all other men in the world? The global average height of men is 5’8 1/2″. So let’s ask again: Are you tall? The lesson here is that we can’t let where we live play an overly important role when we’re trying to provide an objective, evidence-based answer. Applying this concept to investing, let’s examine the importance so many investors attach to the S&P 500 or the Dow Jones Industrial Average. U.S investors tend to heavily measure their portfolio performance against American indices, even though they have been proven not to be the best benchmarks. The S&P 500 is an index of the largest 500 publicly traded U.S. companies, such as Apple, Microsoft, and Ford, weighted by their market capitalization. As such, it’s often used by casual investors as a gauge of stock market performance. In 2014, it did very well—up almost 14%—significantly better than non-U.S. equity markets. Performance Relative to Global Stock Portfolio (click to enlarge) In other years, however, the opposite was true. From 2002 to 2007, the S&P 500 underperformed not only the U.S. stock market as a whole, but also a diversified portfolio and international markets. As American investors, we look to the S&P 500 because it’s familiar and it’s what’s in the headlines. We can’t resist using it as a benchmark for a diversified portfolio. This phenomenon is called home bias. Betterment’s portfolio avoids home bias by reflecting global stock market weights. U.S. stock markets make up roughly half of the world’s investable stock market—the remainder is international developed (43%) and emerging markets (9%). ² It’s important to keep in mind that the S&P 500 represents just over one-third of all the world’s stocks. That means comparing your performance to it is a bit like to comparing your height against only 37% of the world’s people who all come from the same place—say, comparing your height only to the average height of the American male, which is 5’ 9 1/2.” While you might be able to fudge a little with your height, your money is a different story. Using the right evidence—rather than the most convenient context—is the smarter way to invest. Diversification Is a Smarter Investment By using the world’s markets as its baseline, the Betterment portfolio diversifies risk on a number of levels, including currency, interest rates, credit risk, monetary policy, and economic growth country by country. Even as economic circumstances may drag down one nation, global diversification decreases the risk that no one geographic area alone will drag down your portfolio. In short, diversification is a fundamental way to manage risk—it keeps your investment performance more consistent. That’s why we pay so much attention to asset class correlation. ( You can read more about that here .) The result for you, the investor, is that you get the average performance of all the asset classes in which you are invested. If you had only selected one of these asset classes for your portfolio—say, the S&P 500—then you would be at the mercy of that sole index’s performance. By diversifying, you avoid extremes in both gains and losses, and you achieve the same average returns with less uncertainty. Diversification does not guarantee higher returns as compared to each constituent of the portfolio. Rather, diversification is about ensuring average returns—never the best, and never the worst. So, what can you use to compare your performance? The concept of a benchmark basically does not apply to an all-index portfolio. When you’re an index-fund investor—which is what you are when you have a Betterment portfolio—there is no under- or over-performance. You are the average performance. However, it can be useful to have some external yardstick to get a general sense of how you are doing. To do that, you’d need a fund that is similar to your Betterment portfolio with respect to allocation, costs, and diversification. While imperfect, Vanguard’s LifeStrategy Funds could be a point of comparison. If you choose to compare the two, make sure it’s apples-to-apples: Be careful to not equate a 90% stock fund with an 80% stock Betterment account, for instance. But keep in mind that the additional benefits of a Betterment account—general tax efficiency, including tax loss harvesting, free trading, goal-based advice, and more—are likely not included in the performance metrics of a similar non-Betterment diversified portfolio. And next time someone asks you if you are tall, remember that, to be accurate, you need to use the global average before you can say yes or no. Disclosure : Information in this article represents the opinion of the author. No statement in this article should be construed as advice to buy or sell a security. The author does not know your particular objectives for returns or constraints upon investing. All investors are encouraged to do their own research before making any investment decision.
