Tag Archives: week

Despite The Market Rout, U.S. Fund Investors Pull Out Just $5.5 Billion For The Week

By Tom Roseen During the fund-flows week ended August 26 world markets were whipsawed by concerns of slowing global growth, the devaluation of the Chinese yuan, fears about China’s slowing economy, and the continuing plunge of commodity prices. Oil prices slid below $40/barrel for the first time since February 2009 as a result of a decline in global demand and a glut in oil supply. An early measure of China’s factory activity declined to a six-and-half-year low in August, putting additional pressure on the market. As a result the CBOE Volatility Index (VIX) jumped almost 99%-from 15.25 on Wednesday, August 19, to 30.32 on Wednesday, August 26 (but down from a closing high of 40.74 on Monday, August 24), after the main indices posted their largest weekly declines in four years. During the week the U.S. broad-based indices were down at least 10% from their recent market highs, entering what many define as a market correction. At one point on Monday the Dow Jones Industrial Average declined more than 1,000 points before bouncing back slightly, but it still closed down 588.47 points (3.6%) for the day (its largest one-day percentage decline since August 2011). Despite the People’s Bank of China’s cutting its benchmark interest rate 0.5 percentage point on Tuesday and injecting 150 billion yuan into the financial system to prop up China’s market, the Shanghai composite lost 22.85% during the flows week. Nonetheless, on Wednesday U.S. stocks broke a six-day losing streak and witnessed their largest one-day gain in nearly four years as investors pushed stocks higher on news of the PBOC’s new easing efforts, better-than-expected economic news, and comments by New York Fed President William Dudley that the case for a rate hike in September is less compelling, given the volatility in global markets. As one might expect, given the meltdown in the global markets, fund investors were net redeemers of fund assets (including those of conventional funds and exchange-traded funds [ETFs]); however, they redeemed only a net $5.5 billion for the fund-flows week ended August 26, 2015. Investors redeemed some $17.8 billion from equity funds, $2.6 billion from taxable bond funds, and $345 million from municipal bond funds, but they were net purchasers of money market funds, injecting $15.2 billion for the week. For the first week in three equity ETFs witnessed net outflows, handing back $15.2 billion (their largest amount since the week ended August 6, 2014). With concerns about a slowing global economy, authorized participants (APs) were net redeemers of domestic equity funds (-$10.4 billion), withdrawing money from the group for a sixth consecutive week. They also redeemed money from nondomestic equity funds (-$4.9 billion) for the first week in four. Given the selloff in domestic equities, APs turned their attention to the beleaguered small-cap space and safe-haven plays, with the iShares Russell 2000 ETF (NYSEARCA: IWM ) (+$467 million), the iShares MSCI USA Minimum Volatility ETF (NYSEARCA: USMV ) (+$342 million), and the SPDR Gold Trust ETF (NYSEARCA: GLD ) (+$333 million) attracting the largest amounts of net new money of all individual ETFs. At the other end of the spectrum the SPDR S&P 500 Trust ETF (NYSEARCA: SPY ) (-$4.3 billion) once again experienced the largest net redemptions, while the SPDR Dow Jones Industrial Average ETF (NYSEARCA: DIA ) (-$1.0 billion) suffered the second largest redemptions for the week. For the second consecutive week conventional fund (ex-ETF) investors were net redeemers of equity funds, redeeming $2.6 billion from the group. Domestic equity funds, handing back $1.4 billion, witnessed their seventh consecutive week of net outflows. Meanwhile, their nondomestic equity fund counterparts witnessed $1.2 billion of net outflows-handing back money for the first week in six. On the domestic side investors lightened up on mid- and large-cap funds, redeeming a net $0.5 billion and $0.4 billion, respectively, for the week, while equity income funds attracted some $0.7 billion of net inflows. On the nondomestic side international equity funds witnessed $1.0 billion of net outflows, while global equity funds handed back $0.2 billion. For the fifth week in a row taxable bond funds (ex-ETFs) witnessed net outflows, handing back a little less than $4.7 billion (their largest weekly outflows since the week ended August 5, 2014). Corporate investment-grade debt funds suffered the largest net redemptions, witnessing net outflows of $2.2 billion (for their fifth consecutive week of redemptions), while government-mortgage and government-Treasury & mortgage funds were the only fixed income groups attracting net new money for the week, taking in $452 million and $270 million, respectively. For the fourth week in five municipal debt funds (ex-ETFs) witnessed net outflows, giving back $406 million this past week.
Active Managers Strike Back – But Are They Worth It?

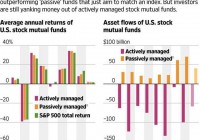
Active management is finally beating the S&P for a quarter – by 1%. Nonetheless, you will not hear the end of it as they fill the MSM with positive stories. We do the math because, maybe, you can do a lot better on your own. (click to enlarge) Active managers finally had a good quarter. As you can see from the chart, it was kind of a pathetic quarter with actively managed funds (who research U.S. stocks before they buy or sell, as opposed to ETFs or other passive funds) outperforming by about 1%. But it’s the first time stock pickers beat the benchmarks since 2013, so you’re going to hear a lot of crowing about it this week. And active managers can afford to crow because they charge you massive fees for that 1% outperformance (once every few years and following last year’s 7% underperformance), so they’ve got lots of money for PR and advertising and that’s why, this week, you’ll be hearing the words ” Active Management ” mentioned over and over again in the MSM, who are very happy to tout the benefits of anything that pays them money. (click to enlarge) I’m not against active management per se – we teach our PSW Members to be active managers of their own portfolios. I’m not fan of ETFs either as you end up buying the bad with the good – I’m simply pointing out that this small, 1% outperformance in one Q of one year should not be used to convince you that active managers have a clue. NO ONE has a clue as to where to invest your money that’s better than your own ideas (assuming you are educated enough to be reading and understanding this in the first place). The TREMENDOUS advantage you have when you learn to invest your own money is that you’re not charging yourself fees. It’s not the performance of active management that kills you – IT’S THE FEES. Even at “just” 1%, over 50 years of investing your active manager is taking 50% of your total account. Unless his long-term outperformance is better than 1% per year, YOU WILL LOSE MONEY WITH ACTIVE MANAGERS. YOU are the best person to invest your own money and our goal is to teach you that it’s not hard to do that. At the base level, you should start by investing in things you know well. When I was seven-years-old (1970), my grandfather told me the same thing and asked me what stock I wanted to invest in and I said ” Cadbury ” because I loved the chocolates (he lived in England). He bought some for me and that became my first stock. When I got older and began investing my own money, I bought tech companies because I was into tech in the 80s. That was very fortunate, of course, because I caught the boom but was it fortunate or was it smart to buy the kind of stuff recent college graduates (me) were into? Intel (NASDAQ: INTC ) seemed like the most obvious stock in the world to me in 1985, as did Apple (NASDAQ: AAPL ). I didn’t need a hedge fund manager to charge me 2/20 for that advice, did I? (click to enlarge) That, by the way, is another thing that doesn’t occur to investors – you don’t NEED to give ALL your money to an active manager. If you have $1M worth of AAPL and $1M worth of IBM and $1M worth of Wal-Mart (NYSE: WMT ) and intend to hold them long-term – why do you need to pay your manager $30,000 a year to hold them for you? If it’s a $10M portfolio, keep your own major positions and let them play with the rest but $30,000 a year over 20 years is $600,000 to hold $3M worth of stock for you – THAT IS A BAD INVESTMENT! I’m going to repeat this because it’s VERY IMPORTANT that you understand this: If you have more than $1M, it pays you to take an active role in your own investing. Aside from the fact that fund/management fees destroy your portfolio’s value over time, managing your own portfolio is a job you can easily handle. Let’s say you have an active manager who matches the S&P over 30 years at 8.5% but he takes a 1% fee – that’s 7.5% to you, right? Compounding just $1M for 30 years at 8.5% nets you back $11,558,251 but giving back JUST 1% of that money to an adviser every year drops your net to $8,754,955 ( play with the numbers here ) – that’s $2.8M you end up paying your ” friendly ” active manager – close to $100,000 per year on the average AND 280% of what you started with. That 1% number is very tricky, isn’t it? Over the course of 30 years, at 8.5% annual growth, you make $7.75M while your manager makes $2.8M. This would be fine if he were beating the S&P for you consistently but, if not – what on Earth are you doing in this relationship? Again, you don’t need to go cold turkey but simply consider taking half of your money out (saving you $1.4M in fees) and investing it yourself in LONG-TERM, CONSERVATIVE strategies . For example, we found two trade ideas on Friday we’ll be adding to the LTP that will go in this week (we didn’t have time on Friday). Those trade ideas were: Chimera (NYSE: CIM ) – Maybe we need to add them back too. Let’s pick up 1,000 for the LTP at $14.63 and sell the Dec $14 calls for 0.85 (no less) and the $14 puts for 0.80 as we REALLY would like to end up with 2,000 since they pay a $1.92 dividend. We may get called away at $14 but that’s OK as our net is $12.98 so, if called away, we just have the short $14 puts and $14 back in our pocket. If not called away, the dividend is 15.2%! (click to enlarge) I’m thinking Sotheby’s (NYSE: BID ) should do well with all this crazy art auction money being spent. (click to enlarge) Would have been nice to think of it earlier but no reason not to sell five 2017 $37 puts for $3 in the LTP, just to keep an eye on them (and get another $1,500 in cash). They only made $117M last year on $1Bn in revenues and Christie’s just had a $2Bn auction so it’s no stretch to imagine Sotheby’s will also have some huge auctions and collect blow-out fees as well. If you’re not used to options trading, you may want to join an educational site that teaches you the finer points of trading before making investments like these but consider the idea of investing that 1% per year in yourself – not in having someone else manage your money – keeping you dependent on them FOREVER! Keep in mind an index ETF like SPY, which has just a 0.09% expense ratio will, by definition, match the S&P’s performance (and pay a 1.89% dividend) pretty much exactly. That’s another huge factor in considering whether or not your active manager is worth a damn. Over the past three years (since 12/31/2011), SPY has gone from $125.50 to $212.44 – that’s up 86.94% in three years. Is your ” active ” man ager doing that for you? Not only that, but SPY has paid 13 dividend checks of about 0.80 each for another $10.40 (8.2%) so, if you had $100,000 on Dec 31st 2011 and just put it in SPY, you’d now have $195,140 – almost double in three years. If the guy you are giving your money to isn’t doing that well for you – consider the possibility that you can do better on your own – even if you just dump it all into SPY, which is the most passive investment you can make. Worth considering? Disclosure: The author is long CIM, BID. (More…) The author wrote this article themselves, and it expresses their own opinions. The author is not receiving compensation for it. The author has no business relationship with any company whose stock is mentioned in this article. Additional disclosure: Positions as indicated but subject to RAPIDLY change (fairly bearish mix of long and short positions – see previous posts for other trade ideas). Positions mentioned here have been previously discussed at www.Philstockworld.com – a Membership site teaching winning stock, options & futures trading, portfolio management skills and income-producing strategies to investors like you.

Investors Grow Wary Of High-Yield, Junk Bond ETFs

Summary ETF investors are pulling out of high-yield, junk bonds. Rising junk bond issuance may be pressuring high-yield market. However, some bond investors may be turning to low-duration junk bond ETFs to hedge rate risks. After staging a decent rally this year, high-yield speculative-grade bond exchange traded funds are now experiencing large withdrawals. Retail investors pulled $1.96 billion from U.S. high-yield funds for the week ended March 11, with 97% of the total, or $1.91 billion from ETFs, writes Matthew Fuller of S&P Capital IQ on Forbes . Over the week ended March 11, the iShares iBoxx $ High Yield Corporate Bond ETF (NYSEArca: HYG ) experienced $1.5 billion in outflows and the SPDR Barclays High Yield Bond ETF (NYSEArca: JNK ) saw $921.6 million in redemptions, according to ETF.com . The large withdrawals and pullback in high-yield bonds may be in response to the sudden influx of $11 billion in speculative-grade debt to hit the market, the biggest sale of securities in almost a year and 26% ahead of last year’s supply, Bloomberg reports. Over the past week, HYG dipped 0.8% and JNK fell 0.5%. “The market is showing some indigestion,” John McClain, a money manager at Diamond Hill Capital Management Inc., said in the Bloomberg article. “It’s harder to find value with a lot of companies taking a ‘now or never’ approach to the market, pouring a lot of supply into the market.” Additionally, short-duration junk bond options also experienced modest inflows, which suggests that some investors may be hedging against potential rate risks ahead. For instance, the SPDR Barclays Short Term High Yield Bond ETF (NYSEArca: SJNK ) , which has a 2.28 year duration, attracted $96.5 million in assets for the week ended March 11 while the iShares 0-5 Year High Yield Corporate Bond ETF (NYSEArca: SHYG ) , which has a 2.26 year duration, added $4.9 million in assets. In contrast, HYG has a 4.03 year duration and JNK has a 4.22 year duration – duration is a measure of a bond fund’s sensitivity to changes interest rates, so a lower duration corresponds with a smaller sensitivity. iShares iBoxx $ High Yield Corporate Bond ETF (click to enlarge) Max Chen contributed to this article . Disclosure: The author is long HYG, JNK. (More…) The author wrote this article themselves, and it expresses their own opinions. The author is not receiving compensation for it. The author has no business relationship with any company whose stock is mentioned in this article.