Northland Power – A Renewable Energy Giant In The Making
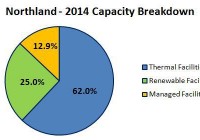
Summary Northland is an independent power producer with a total capacity of 1,356 MW. The company has two giant offshore wind farm projects under construction. These projects should turn the company into one of the world’s biggest renewable energy producers. Currently, Northland shares are undervalued. Northland Power (OTCPK: NPIFF ) is a Canada based independent power producer. As of March 31, 2015, the company owns or has a net economic interest in power producing facilities with a total capacity of approximately 1,356 MW. Northland’s facilities produce electricity from natural gas and renewable resources. Apart from that, the company is developing a few renewable energy projects, which, in a few years, should transform Northland into one of the biggest green companies in the world. In this article I am trying to provide a short description of these projects; in the final section I will try to assess the value of the company’s shares. Capacity As of the end of 2014, the company’s facilities had a total capacity of 1,356 MW, of which the biggest share belonged to thermal facilities (62% of total capacity). The chart below shows the capacity breakdown: source: Simple Digressions and the company’s reports In a few years this situation is going to change. The company has four renewable energy projects under construction (discussed below), which should commence their operations in the next three years. Therefore at the end of 2017, when these projects are finished, the overall company’s capacity should stand at 2,428 MW with renewable energy facilities generating as much as 58.1% of the electricity (chart below). source: Simple Digressions and the company’s reports Northland is turning from thermal generation to renewable energy Looking at the company’s electricity sales it is easily spotted that Northland perceives renewable energy as its main growth driver. Since 2009 the electricity sales generated by thermal facilities have been rising at the rate of 24.7% a year. But in the same time span the electricity sales generated by renewable energy facilities have been rising at much higher rate of 65.8% a year. This trend is going to strengthen in the next three years because all projects under construction are renewable energy ones (wind and solar). Let me discuss these projects in detail. Gemini Gemini is an offshore wind development project located 85 km off the North East coast of the Netherlands. The project will consist of 150 Siemens wind turbine generators, each with a capacity of 4 MW (600 MW in total). Gemini is one the biggest offshore wind projects in the world – the total capital expenditures are expected to be €2.8 billion. Despite these large expenditures, Gemini is an example of a successful non-recourse project financing where expenditures of €2.2 billion will be financed by debt (senior debt of €2.0 billion and subordinated debt of €0.2 billion). The Northland stake in Gemini accounts for 60% – it means that the company’s portion of the equity and junior debt is estimated to be €288 million. The project was awarded up to €4.4 billion of public funding to supplement market revenues from electricity sales. This 15-year award is called SDE Grant and has been issued by the government of the Netherlands. Simply put, the SDE Grant is a contract-for-differences, which supplements market electricity prices traded on the Amsterdam Power Exchange. In order for Gemini to earn the market based component of revenue, a power off-take balancing agreement has been signed with Delta Energy BV, a subsidiary of a Dutch utility company. Currently the financing is closed and Gemini entered its construction phase. The project is expected to be finished in 2017. Northland estimates that Gemini will be producing 2,600 giga-watt hours per year. The company also estimates that the annual EBITDA generated by the project should stand at C$560 – 570 million. Nordsee One Nordsee One, similarly to Gemini, is another offshore wind development project. It is located 40 km north of Juist Island in the North Sea. The project will consist of 54 Senvion wind turbines generators, each with capacity of 6.15 MW (332.1 MW in total). The Nordsee One capital costs are estimated to be €1.2 billion – similarly to Gemini, these expenditures will be financed by non-recourse debt and equity. According to the company’s announcement on the financing close: “Approximately 70% of the project’s required costs will be provided from an EUR840 million non-recourse secured construction and term loan and related loan facilities from ten international commercial lenders. Reflecting the strength of Nordsee One, the financing was oversubscribed. The lending group includes ABN AMRO, Bank of Montreal, Commerzbank, Export Development Canada, Helaba, KfW IPEX, National Bank of Canada, Natixis, Rabobank and The Bank of Tokyo-Mitsubishi” The Northland’s stake in the project accounts for 85%, which means that the company’s portion of equity is estimated to be €288 million. As in the case of Gemini, Nordsee One qualifies for a revenue subsidy. This time it will be a subsidy from the German government granted for 9.6 years (called EEG). It is once again a contract-for-differences, which guarantees a fixed electricity sale price over the subsidy duration. Northland estimates the Nordsee One average annual energy production at 1,200 giga-watt hours; the annual EBITDA generated by the project should stand at C$300 – 310 million. The project is expected to be finished in 2017. Grand Bend Wind Project It is a jointly held (with a 50% stake belonging to the Aamjiwnaang and Bkejwanong First Nations) wind project with a capacity of 100 MW located in Grand Bent, Ontario, Canada. Northland is a developer, construction manager, co-owner and operations manager. The project has a 20-year power purchase agreement with Ontario Power Authority. Project financing is completed and all construction contracts have been signed. The company expects the project to commence operations in spring 2016. The project budget is estimated at C$384 million. Ground-mounted Solar Projects The project consists of 4 individual ground-mounted solar projects with a total capacity of 40 MW. This is a third phase of a partly finished operation, which should be completed in 2015. Northland estimates the project costs to stand at C$329 million, which is around C$83 million higher than previously estimated (this increase is due to legal claims against the former project contractor). The annual EBITDA generated by the project should stand at C$ 22 million. Financial results Since its 2011 conversion from an income trust to a corporation, Northland has been steadily improving its financial results. The company has been increasing its revenue and operating income. On the other hand, due to a very ambitious investment plan realized by Northland, the company’s bottom line looks worse. Finance costs and unrealized losses on derivative contracts are the main contributing factors. For example, in 2014 Northland reported finance costs (interest on debt, borrowings and bank fees) of C$119.9 million. Additionally, Northland reported a loss of C$296.6 million on foreign exchange hedges (these losses were non-cash issues). Therefore, in 2014 the company showed a net loss of C$177.7 million. Now, let me discuss an issue, which is one of the most important metrics in evaluation of any dividend-paying energy company, namely its free cash flow. The chart below evidences free cash flows and dividends paid by the company: (click to enlarge) source: Simple Digressions and the company’s reports As the chart shows, since 2010 Northland has been increasing its dividends. Unfortunately, in the period 2010 – 2012 these increases were not backed by higher free cash flows – the company was over paying its dividends, which was evidenced by the so-called payout ratio, which was higher than 100% (if a payout ratio is higher than 100% a company is paying higher dividend than its free cash flow allows – in the long term such a situation is unsustainable). But since 2013 the company’s dividends have been backed by its free cash flow, with payout ratios of 70 % and 76% in 2014 and 2013 respectively. In the coming years the company expects that its payout ratio will rise over 100% once again. Till 2017 Northland will be involved in construction of two large wind projects (Gemini and Nordsee One). This process demands a lot of money therefore the company, which is determined to sustain its dividends, will have to increase its payout ratio above 100% once again (free cash flow, due to higher investment, will decrease). When both projects are in operation (in 2017) the payout ratio should go well below 100% (due to the increased free cash flow from Gemini and Nordsee One) – please, look at the slide below: (click to enlarge) source: the company’s presentation (page 84) Valuation To estimate value of Northland shares I am using the ratio of EV / EBITDA (enterprise value / earnings before interest, taxes, depreciation and amortization). Because it is quite difficult to find current and reliable EV / EBITDA ratios reported in the renewable energy sector, I am calculating the Northland value using two available ratios: multiple of 9.2 assumed by the Ernst&Young report for base-load independent power producers in the Americas multiple of 14.32 assumed by Aswath Damodaran for Green and Renewable Energy sector In my opinion, the multiple published by professor Damodaran seems to be more appropriate for Northland because this company is currently in a transitory period, which should bring it from a base-load energy producer to a renewable energy company. Another assumption – my calculations are divided into two blocks: Value calculated for current operations Value calculated for two the most important wind projects: Gemini and Nordsee One. Total value is calculated through adding up value of current operations and value of Gemini and Nordsee One. The tables below show the way I have calculated value of Northland: source: Simple Digressions and the company’s reports As the last table shows, I estimate that one share of Northland is worth between $19.9 and $44.6 . Currently the Northland’s shares are trading around C$16 per share, which means undervaluation. Editor’s Note: This article discusses one or more securities that do not trade on a major U.S. exchange. Please be aware of the risks associated with these stocks.

