Adaptive Allocation Applied To A Wasatch Mutual Funds Portfolio
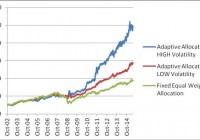
Summary Wasatch Mutual Funds may be used to create a highly profitable portfolio. A fixed allocation portfolio of Wasatch mutual funds delivered good returns over the 2002–2015 time interval. Over the 2002–2007 time interval, the adaptive allocation did not perform better. Adaptive allocation improved the performance substantially only in the 2007–2015 time interval. The following Wasatch funds are used for building the portfolio: Wasatch-Hoisington US Treasury (MUTF: WHOSX ) Wasatch Micro Cap (MUTF: WMICX ) Wasatch Small Cap Growth (MUTF: WAAEX ) Wasatch International Growth (MUTF: WAIGX ) Three different investment strategies will be presented: (1) Fixed Allocation – Portfolio is invested 25% in each fund without rebalancing. (2) Target Allocation – Portfolio is invested 25% in each fund and is rebalanced when the allocation deviates from target by more than 10%. (2) Adaptive Allocation – Portfolio is invested dynamically among the four funds based on a variance-return optimization algorithm developed on the Modern Portfolio Theory (Markowitz). The allocation is rebalanced at fixed one-month intervals. Basic information about the funds was extracted from Yahoo Finance and is shown in table 1. Table 1 Symbol Inception Date Net Assets Yield% Category WHOSX 12/08/1986 322M 2.21 LT Treasury Bonds WMICX 6/19/1995 314M 0.02 Small Cap Growth WAAEX 12/08/1986 2.33B 0.0 Small Cap Growth WAIGX 6/28/2002 1.41B 0.02 Mid Cap Growth The portfolio is built of a high quality bond fund, WHOSX, two US growth funds, WMICX and WAAEX, and an international growth fund, WAIGX. The results reported in this article cover a period of over twelve years between October 1, 2002 and May 31, 2015. The starting day was selected based on availability of historical data of the funds by adding a period of 65 trading days for initial estimation of the parameters used for optimization. In table 2, we show the buy-and-hold results of investing in each fund. Table 2. Symbol T Return % CAGR % max DD% VOL % Sharpe Sortino WHOSX 151.25 7.56 -27.57 16.19 0.47 0.69 WMICX 284.56 11.24 -65.21 22.62 0.50 0.63 WAAEX 288.05 11.32 -56.48 21.62 0.52 0.69 WAIGX 382.57 13.26 -67.66 18.54 0.72 0.85 SPY 186.52 8.68 -55.19 19.61 0.44 0.54 In table 3, we show the simulation results for the portfolios from October 1, 2002 to June 1, 2015. We applied four strategies: Fixed equal weight allocation Target allocation with rebalancing Adaptive allocation for a LOW volatility target Adaptive allocation for a HIGH volatility target Table 3. Tot Ret % CAGR % NO. trad max DD% VOL % Sharpe Sortino Fixed allocation 276.61 11.06 0 -51.48 14.22 0.78 1.00 Target allocation 319.20 12.00 57 -47.68 13.66 0.88 1.14 Adapt. allocation LOW 472.58 14.80 152 -22.68 10.33 1.43 2.01 Adapt. allocation HIGH 902.50 19.74 152 -22.19 14.54 1.36 1.85 As can be seen in table 3, the adaptive allocation with a low volatility target realizes the highest risk adjusted returns, i.e. the highest Sharpe ratio. In figure 1, we show the graphs of the portfolio equities. (click to enlarge) Figure 1. Equity curves for the portfolio with adaptive allocation and the portfolio with fixed allocation without rebalancing. Source: This chart is based on calculations using the adjusted daily closing share prices from finance.yahoo.com. From figure 1, we can see that the fixed allocation performed the best between October 1, 2002 and December 31, 2007. Only starting from January 1, 2008, the adaptive allocations displayed much better performance. As it is already well known, tactical allocation of funds in a portfolio with equities and bonds perform much better during financial crises than fixed allocation. But, it is surprising that the outperformance of the tactical allocation continues to be very strong during a strong bull market. In figure 2, we show the time variation of the adaptive allocation with a low volatility target. As can be seen, the strategy allocated about half of the funds to the bond treasury fund WHOSX over the entire time. This is so because WHOSX is the fund with the lowest volatility. (click to enlarge) Figure 2. Portfolio allocation for a low volatility target. Source: This chart is based on calculations using the adjusted daily closing share prices from finance.yahoo.com. In figure 3, we show the time variation of the adaptive allocation with a high volatility target. (click to enlarge) Figure 3. Portfolio allocation for a high volatility target. Source: This chart is based on calculations using the adjusted daily closing share prices from finance.yahoo.com. Conclusion The Wasatch family of mutual funds is very suitable for creation of investment portfolios with good overall performance. Although fixed asset allocation with rebalancing works quite well, the performance of Wasatch portfolios can benefit greatly from using an adaptive asset allocation strategy. The adaptive allocation strategy is very flexible and allows the investor to adjust the level of risk to match an investor’s risk profile. Additional disclosure: The article was written for educational purposes and should not be considered as specific investment advice. Disclosure: I/we have no positions in any stocks mentioned, and no plans to initiate any positions within the next 72 hours. (More…) I wrote this article myself, and it expresses my own opinions. I am not receiving compensation for it (other than from Seeking Alpha). I have no business relationship with any company whose stock is mentioned in this article.
