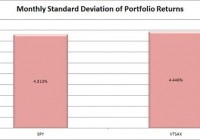
Summary VTSAX offers slightly more diversification than SPY, but it is also slightly more volatile. Because this is a total market fund, it has large weightings for the S&P 500 that create an extremely high correlation. VTSAX is one of the best mutual funds an investor can use for eligible employer-sponsored retirement accounts. Not all plans will offer this fund. VTSAX is the mutual fund version of VTI, which is one of the best total market ETFs available. Investors should be seeking to improve their risk-adjusted returns. Regardless of how they are handling the holdings, the goal is to maximize returns and minimize risks. When it comes to maximizing the returns while maintaining excellent diversification, Vanguard Total Stock Market Index Fund Admiral Shares (MUTF: VTSAX ) is an excellent option. My employer-sponsored retirement accounts are through different brokerages. Mine goes through Schwab, and my wife’s account is with Fidelity. Neither of us is eligible to use VTSAX, but I look for funds that replicate VTSAX, because it embodies most of the things I want in a fund. What does VTSAX do? VTSAX uses an indexing approach to track the performance of the CRSP U.S. Total Market Index. The first thing I’m looking for is diversification, so a total market index seems very attractive. Standard deviation of monthly returns (dividend adjusted, measured since January 2001) The standard deviation is not a problem. Because this is a total market index investors should expect it to be a little more volatile than the S&P 500, and that is exactly what we see. (click to enlarge) Basically, the increase in standard deviation is equivalent to having three percent leverage on a position in SPY. I love low-volatility investments, but when using a retirement account with dollar cost averaging automatically involved, a tiny bit of extra volatility is not problematic as long as the investment is very heavily diversified. Expense Ratio The Admiral shares have an expense ratio of .05%. This is excellent. Largest Holdings The diversification is very good in this mutual fund, and this is easily my favorite thing about the fund. The top 10 holdings appear to be somewhat concentrated, but when you consider that there are over 3800 different securities in the total portfolio, it doesn’t concern me. This is simply a great fund, in my opinion. (click to enlarge) Avoiding Fees There is one downside to Vanguard mutual funds. Vanguard charges a $20 annual account service fee for each mutual fund held in the account with a balance of less than $10,000. If you’re picking VTSAX for a new retirement account and want to save the $20, you can sign up on the Vanguard website for electronic delivery of statements. It appears to me that this fee is largely covering the cost of mailing the investments documents through the postal service. With its huge system in place, being able to send everything by one automated e-mail system saves the company money. I don’t see how it could hold its expense ratio down to .05% without having a way to compel investors to either take electronic delivery or pay for the physical copies. All around, this is a nicely designed system. Want VTSAX from Other Brokerages? You can also effectively invest in the fund using the Vanguard Total Stock Market ETF (NYSEARCA: VTI ), which holds the same assets and has the same expense ratio. Using VTI should automatically avoid the $20 fee and doesn’t require signing up the electronic delivery. The downside about using the ETF is that you would usually be stuck purchasing entire shares. While VTI, shares have been running $107-110; for dollar cost averaging, it is more convenient to be able to buy into a mutual fund with automatic deposits. Conclusion I like VTSAX enough that I’m holding a significant chunk of my portfolio in VTI, the ETF version. Lately, I had been adding to my cash positions rather than my equity positions, because I’m concerned about the market getting a little frothy. Over the last week, I dropped quite a bit of that into buying more broad market ETFs and mREITs when prices dipped. When it comes to long-term investing strategy for the employer-sponsored 401k accounts, my favorite technique is still to use dollar cost averaging on low-fee index funds and to max out (or come close) the contributions every year. If you really want to use VTSAX for your 401k, but are going through Fidelity, I would suggest looking into the Fidelity Spartan® Total Market Index Fund (MUTF: FSTVX ). That is the major mutual fund that I’m using for my wife’s 401k. It has slightly less holdings, with around 3,400 to 3,500 rather than 3,800, but is close enough for my purposes. The correlation between FSTVX and VTSAX is in excess of 99%. Disclosure: I am/we are long VTI, FSTVX. (More…) I wrote this article myself, and it expresses my own opinions. I am not receiving compensation for it (other than from Seeking Alpha). I have no business relationship with any company whose stock is mentioned in this article. Additional disclosure: Information in this article represents the opinion of the analyst. All statements are represented as opinions, rather than facts, and should not be construed as advice to buy or sell a security. Ratings of “outperform” and “underperform” reflect the analyst’s estimation of a divergence between the market value for a security and the price that would be appropriate given the potential for risks and returns relative to other securities. The analyst does not know your particular objectives for returns or constraints upon investing. All investors are encouraged to do their own research before making any investment decision. Information is regularly obtained from Yahoo Finance, Google Finance, and SEC Database. If Yahoo, Google, or the SEC database contained faulty or old information it could be incorporated into my analysis.
