VQTS: A Large Cap Investment That Protects Itself
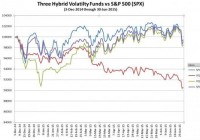
In my opinion the UBS ETRACS S&P 500 VEQTOR Switch ETN ( VQTS) is the best exchange traded product for solving the essential conundrum of the stock market: how to run with the bulls without getting eaten by the bears. The algorithms in VQTS are tuned to outperform the other hybrid volatility funds like the Barclays ETN+ VEQTOR S&P 500 Linked ETN ( VQT) and the VelocityShares Volatility Hedged Large Cap ETF ( SPXH) during good times and to be competitive during the bad times. We don’t have much trade data since UBS only introduced VQTS on December 3rd, 2014. It stumbled in its first month of trading, but then recovered during the first half of 2015-now lagging SPX by only 0.5% since its inception. All of the hybrid volatility funds dynamically allocate assets into the S&P 500 (SPX), VIX futures, and cash depending on market conditions. VQTS is the first fund of this type that invests all of its assets into the S&P 500 when the market’s overall volatility is low. This avoids the costs of hedging when the market is least likely to go down-during the long upward stretches of bull markets. In comparison, two similar funds, Barclays’ VQT and the PowerShares S&P 500 Downside Hedged Portfolio ETF ( PHDG) both have at least 2.5% of their assets allocated to long volatility-and that small amount significantly drags down their returns during bull markets. The chart below compares the simulated performance of VQTS compared to SPX, VQT, and SPXH from early 2006. VQTS defines low volatility as being historical volatility less than 10% using the higher of two exponentially weighted moving averages on volatility. If realized volatility climbs above 20% VQTS starts holding cash and volatility securities (2/3rds cash, 1/3rd volatility) in addition to the large cap S&P 500. The table below shows the range of asset allocations as realized volatility increases. VQTS Asset Allocations Realized Volatility (exponentially weighted) Equity % Volatility % Cash % 0% to 10% 100% 0% 0% 10% to 20% 90% to 80% 3.3% to 6.7% 6.7% to 13.3% 20% to 30% 80% to 70% 6.7% to 10% 13.3% to 20% 30% to 40% 70% to 60% 10% to 13.3% 20% to 26.7% 40% to 50% 60% to 50% 13.3% to 16.7% 26.7% to 33.3% 50% to 60% 50% to 40% 16.7% to 20% 33.3% to 40% 60% to 70% 40% to 30% 20% to 23.3% 40% to 46.6% 70% to 80% 30% to 20% 23.3% to 26.7% 46.6% to 53.3% 80% to 90% 20% to 10% 26.7% to 30.0% 53.3% to 60% In October 2008 the realized volatility as computed by VQTS’ algorithms peaked at 82% When not fully allocated to equities VQTS takes a long or short position in VIX futures depending on the curvature of the futures’ term structure. The term structure is the curve that’s formed if you plot VIX futures’ price vs time to expiration. The decision to go long or short is determined by the comparison between the slope of the two nearest to expiration futures (1st and 2nd) and the slope of the 4th and 7th month futures. I’ve marked up the chart below from vixcentral.com to illustrate the calculation. VQTS’ curvature calculation is similar, but not identical to the more familiar designations of contango and backwardation for futures’ term structures. In general VQTS will go long volatility if the term structure is in backwardation (futures prices less than spot), and short volatility if the curve is in contango. This approach would have worked well in the past, profiting from the fast rise of volatility as a crash / big correction develops, and then switching to be short volatility as volatility mean reverts. The chart below shows the simulated performance of VQTS during the 2008/2009 crash. VQTS experienced around a 20% drawdown in the fall of 2008 before rallying to a year end gain of +13%. Many strategies that backtest well on historical data do not perform well once they go live, but as I noted at the beginning of this post VQTS has already shown that it can approximate the S&P 500 during periods of low volatility-the condition the market is in 75% of the time. VQTS’ drawdowns during crashes and corrections are likely to be significant, but VQTS’ strategy of going long volatility during panicky periods and short volatility during the recovery should continue to work well as a way to power through downturns. VQTS is still a small fund with only $25 million in assets, so investors are hesitant to invest in it, but since the S&P 500 and VIX futures are its underlying securities its liquidity is excellent. Bid/ask spreads have been reasonable-in the 6 to 7 cent range (0.3%). Over time I expect its assets to grow into the $500 million range of its closest competitors, VQT and PHDG. Everyone knows this bull market will end, the tough part is guessing when. With VQTS you can ride the bull and be prepared for the inevitable bad ending. Disclosure: None
