Tag Archives: volatility

Volatility Is An Asset Class That Can Be Sold As Well As Bought

By DailyAlts Staff The CBOE Volatility Index more than tripled during the course of trading on August 24, 2015 – an all-time record. On that same day, the S&P 500 fell nearly 4%, while the Barclays U.S. Aggregate Bond Index gained a miniscule 0.03%, demonstrating the ineffectiveness of the standard two asset class portfolio diversification model. Puny bond yields provide little cushion for broad market selloffs, which has led many investors to turn to alternative strategies and asset classes, including volatility itself. This is the subject of a new white paper from Allianz Global Investors (“Allianz GI”): Volatility as an Asset Class . Volatility: Realized vs. Implied The paper’s author, Dr. Bernhard Brunner, is Allianz GI’s Head of Analytics and Derivative. He begins by discussing the difference between realized volatility – the standard deviation of logarithmized returns; and implied volatility – that which is measured by the CBOE Volatility Index (VIX). Realized volatility is typically less than implied volatility, and this means buying implied volatility, such as through VIX futures, comes with a volatility risk premium . Thus, while the negative correlation between equities and equity volatility makes buying implied volatility seem like a good portfolio diversifier, the consistent volatility risk premium makes it even more attractive to sell volatility, according to Dr. Brunner. Variance Swaps In addition to taking short positions in VIX futures or ETPs that track volatility, investors can also sell volatility through so-called variance swaps . Variance swaps are traded “OTC” (“over the counter”), but swaps on equity indexes such as the S&P 500 and EuroStoxx 50 are highly liquid nonetheless. And while VIX futures may have considerable variance from realized volatility, variance swaps can be structured so their payoff is exactly equal to the difference between realized and implied variances, thereby constituting a more precise definition of the volatility risk premium. Allianz GI’s Approach Allianz GI has developed an index to earn the volatility risk premium by systematically selling variance swaps on the S&P 500 and EuroStoxx 50. Its investment approach is governed by specific rules and based on the following characteristics of volatility as an asset class: (click to enlarge) Volatility always reverts to its long-term mean; Volatility tends to bounce briefly when the stock market slumps, followed by lengthier downward trends; and Volatility forms volatility clusters. Volatility offers a lot of promise as an asset class, based on its portfolio-diversification advantages. Most notably, volatility has what Dr. Brunner describes as an “immunity to interest trends,” which makes it virtually unique among investible assets, and particularly attractive in the current investment environment. For more information, download a pdf copy of the white paper . Share this article with a colleague

A Look At Direxion’s Revised S&P 500 Volatility Response Shares ETF

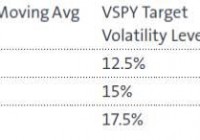
Summary Direxion’s newly revised VSPY offers investors a transparent, formula-based volatility hedge for U.S. equities. The fund employs dynamic, daily-rebalanced exposure, rather than attempting to time entry/exit points. I recreate a similar index to back-test Direxion’s strategy on two recent “black-swan” events. Back in January of 2012, Direxion made a few ripples when it announced the launch of three new ETFs giving investors access to the S&P Dow Jones Indices’ Dynamic Risk Control Index series. Unlike the few existing hedge products of the day, these ETFs didn’t try switching between the market and the VIX itself, rather they employed a more conservative approach and, in times of heightened volatility, switch into Treasury Bills instead. Certain aspects of these funds must have fallen out of favor however, as in August of 2014 Direxion announced an index and name change to its largest of the three funds, the Direxion S&P 500 RC Volatility Response Shares ETF (NYSEARCA: VSPY ) . VSPY follows the S&P DJI index of the same name (Bloomberg ID: SPXVRT). If you’re trying to find the index’s specific page on S&P’s website, I’m afraid it doesn’t exist. An e-mail to S&P in February returned the simple response “…the page is still under development at this time.” Regardless, VSPY’s literature explains the fund’s process in enough detail. Methodology From VSPY’s fact sheet : The strategy follows a quantitative rules-based equity index that seeks to mitigate risk by dynamically changing total equity exposure based on volatility signals. The strategy reallocates exposure between equities and U.S. Treasury Bills (T-Bills) based on recent volatility levels of the S&P 500 ® Index. The strategy employs a downside risk mitigation strategy during periods of higher volatility and increases equity exposure when appropriate. Basically, VSPY holds the S&P 500 U.S. Large-Cap Index and tracks some formula of market volatility to determine how much to stow away into Treasuries. That formula is comprised of two parts: a Volatility Level, and a Volatility Signal. The Volatility Level is simply determined by tracking the 20-day moving average of the CBOE Volatility Index (VIX), and pulling the value from the following table: Calculation of the Volatility Signal is less clear. In “Step 2” on VSPY’s fact sheet, it’s referred to as simply the “…(standard deviation) of the S&P 500 Index,” yet from the fund’s prospectus, “The [fund] then reviews several volatility factors of the S&P 500 Index. The volatility factors of the S&P 500 Index are exponentially weighted with more emphasis placed on the most recent historical periods.” This duality begs a couple questions: What are these several factors? Over what period are these factors analyzed? How are they exponentially weighted? My guess is Direxion needs to keep at least some part of this fund a trade secret, but we digress. Once calculated, the fund then uses these two volatility values to determine its equity holding, according to the following formula: This method is fully capable of holding 100% equity, and per the rules, never holds less than 10%. Running the spectrum of possible inputs generates the following Equity Exposure chart: (click to enlarge) The result is the fund is able to withdraw from the market when the water gets choppy, and ease back in when volatility settles. The three distinct Volatility Levels (probably derived from historical analysis) allow the fund to maintain appropriate equity exposure during varying degrees of whatever happens to be “normal” volatility. VSPY, unlike most lumbering ETFs that rebalanced on a quarterly basis, has the ability to modify its exposure daily, and does so at least monthly. There’s mention of “thresholds” the fund employs to likely keep from rebalancing too often and running up transaction costs. Investors in VSPY of course want to know how it performs relative to just the plain old S&P 500. The SPDR S&P 500 Trust ETF (NYSEARCA: SPY ) is a good benchmark. Data for VSPY however only goes back to January 2012 when the fund began trading. It should be no surprise that throughout the ongoing bull market VSPY has underperformed the S&P 500. As the chart below shows, VSPY on average does return ~1.5% less volatility on a monthly basis; however, its low trading volume and lower yield have resulted in periods where its volatility actually exceeded that of the S&P 500: (click to enlarge) Obviously, comparing a volatility hedge fund to its equity index isn’t fair in a bull market. Since we’re essentially comparing risk-returns, I’m sure someone in the comments will ask “Well, why don’t you just compare their Sharpe Ratios?” I’ll caution that the Sharpe Ratio is best for apples-to-oranges comparisons where the strategies and holdings are different. VSPY and SPY hold the exact same equities; a chart of these funds’ returns vs. their risks will just be a translation of VSPY’s equity exposure chart. Notwithstanding, strategies like these still beg to be stress tested. As I discuss later, I believe VSPY’s target audience is probably the crowd that fears drawdowns above all. Two popular “black-swan” events of the recent past are the Dot-Com bust of the early 2000s and the Mortgage Bubble collapse of 2008. Since neither VSPY’s data (nor index) go that far back, we’ll need to use the equity allocation formula above to reconstruct this fund’s index. The Volatility Level is easily gathered from historical VIX values, however, that Volatility Signal remains a mystery. For this analysis, I’m using a 20-day moving average of the S&P 500’s annualized volatility. I also blindly (i.e. no threshold) rebalance the index once a week, based on the previous week’s determined equity exposure. The chart below compares my best attempt at recreating the S&P 500 Volatility Response Shares Index with VSPY: (click to enlarge) As you can see, it’s not perfect. Clearly, VSPY’s threshold for rebalancing and/or the mysterious means it uses to determine S&P 500 volatility are large performance factors. Despite the green-line correlation dipping negative for some moments, our recreated index’s overall correlation for this period is actually above 0.90. I believe that’s enough to press on with our stress tests, but please take the following charts with a bowl of salt: (click to enlarge) (click to enlarge) At first glance, it works! VSPY’s equity allocation algorithm successfully allows the fund to avoid catastrophic plunges. The long game however is a different story. Since as far back as SPY’s data goes, our reconstructed index has struggled to keep up. I’ve also included the Vanguard Balanced Index Fund (MUTF: VBINX ) for comparison: (click to enlarge) Again, my attempt at reconstructing the S&P 500 Volatility Response Index was less than stellar and underperformed the actual VSPY for its first year. However, the inclusion of VBINX in the above chart is to emphasize that while a carefully constructed volatility hedging strategy might lessen the blow of an economic downturn, so does diversification. Replicating the Strategy Yourself One thing to watch out for is purveyors of these boutique funds like to charge significant expense ratios, some more justified than others. In VSPY’s case, the fund is simply switching between two components, the S&P 500 and short-term U.S. Treasuries. Go figure there’s a world of low-cost ETFs for both of those asset classes; we have SPY to access large-cap U.S. equities and the Schwab Short-Term U.S. Treasury ETF (NYSEARCA: SCHO ) for short-term Treasuries. Expense ratios are 0.0945% and 0.08% respectively. In comparison, VSPY’s expense ratio of 0.45% is more than quadruple that of SPY, but there’s two catches: If your platform charges any more than $0.99 for commissions, rebalancing on a daily or weekly basis, even with just one ETF, will kill your returns. The 500 components of the S&P 500 all operate on different dividend schedules, when you lump them into an ETF like SPY, you as an investor have a once-a-month shot to capture those dividends. Since VSPY owns 500+ individual stocks within its equity portfolio, it can far more efficiently expose its assets to that income calendar. For these reasons, I think VSPY’s expense ratio of 0.45% is quite reasonable, it’s also half that of the average hedged ETF . Similar ETFs RBS runs a similar series of volatility-averse funds called the Trendpilot family. When a simple 200-day moving average trigger is reached, these funds dump all of their holdings into Treasuries until the trend breaks and they re-enter their equity position. Though the prospectus for their RBS U.S. Large Cap Trendpilot ETN (NYSEARCA: TRND ) claims long-term outperformance of its benchmark, the 100% on/off strategy can result in a very choppy investing experience. As I postulate in this article , these switching-style funds are most likely marketed towards the Nervous Nellie’s. Folks that reasonably don’t want to be caught off-guard by a dot-com bust or hidden mortgage crisis. On the same note however, I can also imagine how watching assets skyrocket while one’s supposed sleep-well fund is still holding flat-line Treasuries probably induces the same performance anxiety. Dynamic exposure, as we see in VSPY, is a fair compromise. Alternative Strategies As a dozen asset allocation articles on Seeking Alpha will tell you, diversification is not to be overlooked. The same risk-return profile offered by VSPY can easily be achieved with proper diversification. Replacing one’s equity portfolio allocation with VSPY might produce an interesting conservative combo. Selling calls against one’s equity holdings can also generate income and help reduce volatility. A variety of passive ETFs exist to make this alternative easy. Though it’s enjoyable to sell one’s own calls, watch your brokerage for added costs. I quit using OptionsHouse because they started charging a processing fee on letting options expire. Closing Remarks Direxion’s VSPY offers investors convenient, low-cost access to U.S. equities while hedging against short- to mid-term rises in volatility. Rather than attempt to time the market like similar ETFs, VSPY reacts organically, withdrawing when the water gets choppy and easing back in when skies begin to clear. Our reconstructed index shows the strategy can help avoid catastrophic downturns, but will lag in bull markets. Low volume and little dividends also hurt performance. Alternative strategies such as covered-call selling or asset diversification can probably produce the same hedging effects. Disclosure: I/we have no positions in any stocks mentioned, and no plans to initiate any positions within the next 72 hours. (More…) I wrote this article myself, and it expresses my own opinions. I am not receiving compensation for it (other than from Seeking Alpha). I have no business relationship with any company whose stock is mentioned in this article.

Investing For Retirement Using Northern Mutual Funds

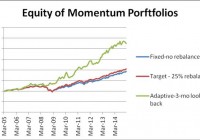
Summary A set of just three Northern mutual funds, a bond, a large cap stock plus a mid cap fund generates good returns with relatively low risk. From January 2005 to January 2015, a Northern portfolio with fixed allocation could allow a safe 5% annual withdrawal rate with 1.36% increase of the capital. Same portfolio with rebalancing at 25% deviation from the target allowed a safe 5% annual withdrawal rate and 2.05% annual increase of the capital. Same portfolio with momentum-based adaptive allocation could have produced a safe 10% annual withdrawal rate and 1.26% annual increase of the capital. This article belongs to a series of articles dedicated for investing in various mutual fund families. In previous articles we reported our research on Fidelity , Vanguard , T Rowe Price , American Century , and Schwab mutual fund families. The current article does the same for Northern family of mutual funds. In addition, this article is the first in which a detailed study of the volatility of the returns using Sharpe and Sortino’s ratios is included. The series of these articles is aimed at a broad spectrum of investors. They may be useful to small individual investors as well as to any large institution managing retirement accounts. The general methodology we use in selecting the funds for the portfolio was presented in a previous article. The portfolio includes three funds: one bond fund and two equity funds. The equity funds are complementary: one covers large capitalization; the other fund contains medium capitalization stocks. The mutual funds selected for investment are the following: Northern us Treasury Index fund (MUTF: BTIAX ) Northern Stock Index fund (MUTF: NOSIX ) Northern Mid Cap Index fund (MUTF: NOMIX ) As in the previous articles, three different strategies are considered: (1) Fixed asset allocation. The portfolio is initially invested 50% in the bond fund and 50% equally divided between the two stock funds, without rebalancing. (2) Target asset allocation with rebalancing. The portfolio is initially invested 50% in the bond fund and 50% equally divided between the two stock funds and is rebalanced when the allocation to any fund deviates by 25% from its target. (3) Momentum-based adaptive asset allocation. The portfolio is at all times invested 100% in only one fund. The switching, if necessary, is done monthly at closing of the last trading day of the month. All money is invested in the fund with the highest return over the previous 3 months. The data for the study were downloaded from Yahoo Finance on the Historical Prices menu for three tickers: BTIAX, NOSIX, and NOMIX. We use the monthly price data from January 2005 to January 2015, adjusted for dividend payments. The paper is made up of two parts. In part I, we examine the performance of portfolios without any income withdrawal. In part II, we examine the performance of portfolios when income is extracted periodically from the accounts. Part I: Portfolios without withdrawals We report the performance of the portfolios under two scenarios: (1) no withdrawals are made during the time interval of the study, and (2) withdrawals at a fixed rate of the initial investment are made periodically. In table 1 we show the results of the portfolios managed for 10 years, from January 2005 to January 2015. Table 1. Portfolios without withdrawals 2005 – 2015. Strategy Total increase% CAGR% Number trades MaxDD% Fixed-no rebalance 93.45 6.82 0 -21.87 Target-25% rebalance 104.52 6.36 3 -31.09 Momentum-Adaptive 224.84 12.84 39 -13.35 In table 2 we show the results of a study on the volatility of the returns, including the much celebrated Sharpe and Sortino ratios. For completeness we give the definitions of these ratios. Sharpe ratio is the ratio of the compound annual growth rate (CAGR%) and the volatility of the returns (VOL%), where the volatility is defined as the annualized standard deviation of the returns. Sortino ratio is the ratio of the compound annual growth rate (CAGR%) and the volatility of the negative returns (NEG VOL%), where the volatility is defined as the annualized standard deviation of the negative returns. Table 2. Volatility performance of portfolios without withdrawals 2005 – 2015. Strategy CAGR% VOL% NEG VOL% Sharpe Sortino MaxDD% Fixed-no rebalance 6.82 7.18 6.29 0.95 1.08 -21.87 Target-25% rebalance 7.42 7.61 6.51 0.98 1.14 -31.09 Momentum-Adaptive 12.84 10.46 7.24 1.23 1.77 -13.35 By analyzing these results, one can see that the target portfolio has higher Sharpe and Sortino ratios than the fixed portfolio. On the other hand, the fixed portfolio has much lower maximum drawdown than the target portfolio. Which one is a better metric of risk: the volatility or the maximum drawdowns? Most investors, including the author of this article, are mostly concerned about large drawdowns, and pay less attention to Sharpe or Sortino ratios. The time evolution of the equity in the portfolios is shown in Figure 1. (click to enlarge) Figure 1. Equities of portfolios without withdrawals. Source: This chart is based on EXCEL calculations using the adjusted monthly closing share prices of securities. From figure 1 it is apparent that the rate of increase of the adaptive portfolio is substantially greater than the rate of the fixed and target allocation portfolios. Part II: Portfolios with withdrawals Assume that we invest $1,000,000 for income in retirement. We plan to withdraw monthly a fixed percentage of the initial investment. That amount is increased by 2% annually in order to account for inflation. In table 3 we show the results of the portfolios managed for 10 years, from January 2005 to January 2015. Money was withdrawn monthly at a 5% annual rate of the initial investment plus a 2% inflation adjustment. Over the 10 years from January 2005 to January 2015, a total of $535,920 was withdrawn. Table 3. Portfolios with 5% annual withdrawal rate 2005 – 2015. Strategy Total increase% CAGR% Number trades MaxDD% Fixed-no rebalance 14.51 1.36 0 -25.27 Target-25% rebalance 22.51 2.05 2 -26.77 Momentum-Adaptive 111.84 8.22 38 -16.56 The time evolution of the equity in the portfolios is shown in Figure 2. (click to enlarge) Figure 2. Equities of portfolios with 5% annual withdrawal rates. Source: This chart is based on EXCEL calculations using the adjusted monthly closing share prices of securities. To illustrate the advantage of the adaptive allocation strategy and the effect of withdrawal rates on the evolution of the capital, we give in Table 4 the results of simulations for the following withdrawal rates: 0%, 5%, 8%, and 10%. Table 4. Adaptive Portfolios with various annual withdrawal rates 2005 – 2015. Withdrawal rate % Total increase% CAGR% MaxDD% 0 224.84 12.84 -13.35 5 111.84 8.22 -13.97 8 52.33 4.53 -16.56 10 12.67 1.26 -20.25 The time evolution of the equity in the portfolios is shown in Figure 3. (click to enlarge) Figure 3. Equities of momentum-based portfolios with various annual withdrawal rates. Source: This chart is based on EXCEL calculations using the adjusted monthly closing share prices of securities. Conclusion The set of three Northern mutual funds, selected for this study, perform well for all three strategies and generate sustainable returns at relatively low drawdowns. Between 2005 and 2015, the fixed target allocation with rebalancing was able to sustain withdrawal rates of up to 5% annually. The adaptive allocation algorithm was able to sustain withdrawal rates up to 10% annually without any decrease of capital. Additional disclosure: This article is the sixth in a sequence on investing in mutual funds for retirement accounts. To help the reader compare the past performance of various mutual fund families, I selected a benchmark 10-year time interval starting on 1 January 2005 and ending on 31 December 2014. The article was written for educational purposes and should not be considered as specific investment advice. Disclosure: The author has no positions in any stocks mentioned, and no plans to initiate any positions within the next 72 hours. (More…) The author wrote this article themselves, and it expresses their own opinions. The author is not receiving compensation for it (other than from Seeking Alpha). The author has no business relationship with any company whose stock is mentioned in this article.