Tag Archives: venezuela

Oil ETFs To Watch As Crude Slips To Below $40 Again

U.S. crude again trickled to below $40 per barrel on Wednesday following the bearish inventory storage report from EIA that has deepened global supply glut and amid fresh fears that the world’s largest oil producers will not cut production when they meet on Friday. The prospect of interest rates hike and the resultant surge in dollar added to the woes. As such, U.S. crude plunged 4.6% on the day while Brent slumped 4.2% to the nearly seven-year low. The inventory data showed that U.S. crude stockpiles unexpectedly rose by 1.2 million barrels in the week (ending November 27). This marks the tenth consecutive week of increase in crude supplies. Total inventory was 489.4 million barrels, which is near the highest level in at least 80 years. As the Organization of the Petroleum Exporting Countries (OPEC) is due to meet on Friday, the market is not expecting the members to arrest production. Instead they are expected to pump oil vigorously to protect their market share. If this happens, crude will continue to be in a free-fall territory like it was last year when OPEC had decided not to cut production. However, Saudi Arabia and its Persian Gulf allies are willing to cut back if other producers like Iran, Iraq, and Russia join them in the mission. In fact, at the meet, Saudi Arabia may propose a cut of 1 million barrels per day in the OPEC output to strike a balance in the oil markets. Outlook Remains Bleak The current fundamentals are not in favor of oil with rising output and waning demand. This is especially true as OPEC is pumping record oil since Saudi Arabia and other big producers are focusing on market share. Iran is looking to boost its production once the Tehran sanctions are lifted. Meanwhile, oil production in the U.S. has been on the rise and is hovering around its record level. On the other hand, demand for oil across the globe looks tepid given slower growth in most developed and developing economies. In particular, persistent weakness in the world’s biggest consumer of energy – China – will continue to weigh on the demand outlook. Notably, manufacturing activity in China shrunk for the fourth straight month in November to a 3-year low. The International Monetary Fund recently cut its global growth forecast for this year and the next by 0.2% each. This is the fourth cut in 12 months with big reductions in oil-dependent economies, such as Canada, Brazil, Venezuela, Russia and Saudi Arabia. That being said, the International Energy Agency (IEA) expects the global oil supply glut to persist through 2016 as worldwide demand will soften next year to 1.2 million barrels a day after climbing to five-year high of 1.8 million barrels this year. ETFs to Watch Given the bearish fundamentals and the OPEC meeting tomorrow, investors should keep a close eye on oil and the related ETFs. Below we have highlighted some of the popular ones, which could see large movements ahead of the OPEC decision: United States Oil Fund (NYSEARCA: USO ) This is the most popular and liquid ETF in the oil space with AUM of over $2.5 billion and average daily volume of over 25.7 million shares. The fund seeks to match the performance of the spot price of WTI. The ETF has 0.45% in expense ratio and lost 3.6% in the Wednesday trading session. iPath S&P GSCI Crude Oil Index ETN (NYSEARCA: OIL ) This is an ETN option for oil investors and delivers returns through an unleveraged investment in the WTI crude oil futures contract. The product follows the S&P GSCI Crude Oil Total Return Index, a subset of the S&P GSCI Commodity Index. The note has amassed $813.3 million in AUM and trades in solid volume of roughly 3.7 million shares a day. Expense ratio came in at 0.75% and the note was down 3.3% on the day. PowerShares DB Oil Fund (NYSEARCA: DBO ) This product also provides exposure to crude oil through WTI futures contracts and follows the DBIQ Optimum Yield Crude Oil Index Excess Return. The fund sees solid average daily volume of around 311,000 shares and AUM of $477.9 million. It charges an expense ratio of 78 bps and lost 2.9% in Wednesday’s trading session. United States Brent Oil Fund (NYSEARCA: BNO ) This fund provides direct exposure to the spot price of Brent crude oil on a daily basis through future contracts. It has amassed $82.7 million in its asset base and trades in a moderate volume of roughly 109,000 shares a day. The ETF charges 75 bps in annual fees and expenses. BNO lost 3.7% on the day. Original post .
Oil Price Impact On Single Country ETFs

Single country ETFs demonstrate widely varying dependence on oil price. Canadian, Columbian, Norwegian and Russian ETFs are the most correlated to USO. Chinese and Indian ETFs are among the least correlated. In a recent article about primary beneficiaries of a potential oil price rebound, Zacks Funds identified Russia, Malaysia and UAE with their respective ETFs as the ones that could make a turnaround if the oil price makes a sustained move higher. This prompted me to look at a wider universe of single country ETFs and investigate their performance dependency on oil price. For this exercise I compiled a list of 45 US listed single country ETFs. All of the funds are market cap weighted and I did my best to pick the ETFs with the highest assets under management (AUM) for each country. I then obtained correlation estimates with the United States Oil Fund ETF (NYSEARCA: USO ) using a free online tool InvestSpy. Below is a full results table, calculated utilizing 1 year of historical data: There are a few observations to be made from the correlation coefficients above: It turns out that the most correlated ETFs with the recent oil price movement were the iShares MSCI Canada ETF (NYSEARCA: EWC ), the Global X MSCI Colombia ETF (NYSEARCA: GXG ), the Global X MSCI Norway ETF (NYSEARCA: NORW ) and the Market Vectors Russia ETF (NYSEARCA: RSX ). Each of these four ETFs had a correlation coefficient above 0.50 with USO, which is a relatively high number in the cross-asset class dimension. This probably does not come as a big surprise given that all four economies are significant oil exporters as can be seen from the interactive map provided by The Economist. So in a search for country ETFs that could benefit from rising oil price, these would be the first options I would consider. Some of the countries that one would expect to find at the top of the list are not there. One part of the explanation is that there are a lot of major oil countries without an ETF targeting local stocks. This includes Saudi Arabia, Iran, Iraq, Venezuela and a number of African countries. However, some other key oil exporters like UAE, Qatar and Nigeria make appearance outside the top 10. I believe a big reason for this is the iShares MSCI UAE Capped ETF (NASDAQ: UAE ), the iShares MSCI Qatar Capped ETF (NASDAQ: QAT ) and the Global X Nigeria Index ETF (NYSEARCA: NGE ) were launched only 1-2 years ago and have seen only a limited interest from investors thus far. None of them has more than $50 million in AUM and liquidity is subpar, therefore prices can be stale, consequently pushing down the correlation with other securities. This is something investors should take into account before making an investment decision. Finally, I thought it would be interesting to take a closer look at the countries at the bottom of the list, i.e. the ones least correlated with oil price. It was somewhat unexpected to see China and India at the very bottom of the list. But both countries are net importers of oil, generally benefiting from lower oil prices, which pushes correlation coefficients for the iShares China Large-Cap ETF (NYSEARCA: FXI ) and the iShares MSCI India ETF (BATS: INDA ) against USO lower. For investors with a stronger view on oil outlook, this can be a differentiating factor when comparing developing countries as potential investments. If you have more observations from the correlations table in this article, feel free to share them in the comments to facilitate further discussion. Disclosure: I/we have no positions in any stocks mentioned, and no plans to initiate any positions within the next 72 hours. (More…) I wrote this article myself, and it expresses my own opinions. I am not receiving compensation for it (other than from Seeking Alpha). I have no business relationship with any company whose stock is mentioned in this article. Share this article with a colleague

Sell The State, Buy The People

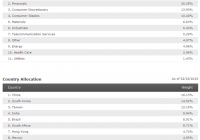
Summary State-owned companies dominate many emerging-market ETFs. State-owned companies generate lower return on assets than privately-managed firms. Avoiding the slower-growing state firms by going with small caps, or a fund such as XSOE. Investors can slice and dice the investment world into all manner of categories. One of the most common is to separate its investments into domestic and international, developed and emerging markets, then into regions or individual countries. A different way to slice the market is to break it down into state-owned and private companies. This is not a critical distinction for investors in the developed world, where deep capital markets offer exposure to many private firms, but many emerging markets are still developing their capital markets. A passive investment approach in emerging markets results in a state-owned heavy portfolio, but there are ways to avoid this exposure. State Interference Doesn’t Pay At least since Ludwig Von Mises published Economic Calculation in the Socialist Commonwealth , the case against socialist economic planning has been there for those who choose to look. Without information, an enterprise cannot make good decisions, and one of the first casualties of central planning is the informational content in prices. Prices exist in centrally-planned economies, but they do not reflect the supply and demand in the economy. The unfolding disaster in Venezuela, a country that suffered toilet paper shortages and is now occupying supermarkets with the army in its never-ending war against the laws of economics, is only the latest example of this basic truth. Clearly, one does not want to invest in a basket case such as Venezuela. At the other end, one cannot avoid some intervention in the economy, as nearly every nation on Earth has a central bank working to manipulate interest rates. In between are the mixed economies such as in China, where the transition to market capitalism is still incomplete. These countries have varying degrees of market forces, but one common trait in many is that state-owned enterprises (SOEs) compete alongside private firms. In many of those countries, the state-owned giants dominate the stock market and make up the bulk of market capitalization. The extreme case is China, where most of the listed companies on the mainland stock exchange are SOEs. In Brazil, semi-private Petrobras (NYSE: PBR ) has accounted for 20 percent of stock market capitalization alone. As oil prices have tumbled and PBR sees corruption charges swirl around the firm , investors in funds such as iShares MSCI Brazil (NYSEARCA: EWZ ) have paid the price. Investors who passively plunk money into market capitalization index funds are often unknowingly choosing to invest with the state and even where the firms are increasingly competitive, they still often lag behind fully-privatized competitors. Recent figures show that Chinese SOEs earn about 5 percent on assets , versus roughly 9 percent for private firms. SOEs in China achieve this low return despite access to cheap credit and regulatory favoritism, in part because the largest shareowner, the state, cares about many things besides profit. Additionally, the government officials in charge of these firms have their own private agendas, and those often stray into the realm of corruption. Some recent examples are the lackluster performance of Russian energy firms even when oil prices were high, Chinese banks that have run up a mountain of bad debt due to politically-motivated lending, and as mentioned above, Brazil’s largest company is racked with scandal. Aside from the aforementioned issues, there’s the issue of sector exposure. Many state-owned companies are banks, energy producers, utilities and telecom firms. While these companies can experience rapid growth in a rapidly-growing economy, they aren’t growing as fast as technology start-ups and new consumer companies catering to an emerging and increasingly wealthy middle class. Investment Options There are some ways around this, the easiest of which is to go with small caps, though that involves taking on more volatility. Broad small-cap ETFs, such as WisdomTree Emerging Markets SmallCap Dividend (NYSEARCA: DGS ), reduce exposure to SOEs. Guggenheim China Small Cap (NYSEARCA: HAO ) and Market Vectors Brazil Small Cap (NYSEARCA: BRF ) both offer a different mix of sector exposure along with avoiding the giant SOEs that populate many emerging-market ETFs. Some sector ETFs, such as KraneShares CSI China Internet (NASDAQ: KWEB ) achieve the same result. WisdomTree Emerging Markets ex-State-Owned Enterprises (NYSEARCA: XSOE ) WisdomTree launched XOSE in December to help investors maintain emerging market exposure while avoiding state-owned companies. The case for the fund is straightforward: the growth of emerging markets is the story of a rising middle class. The sectors most poised to benefit are those that serve these customers: consumer staples, consumer discretionary and healthcare firms. Technology is also an emerging sector in many of these countries that is growing far faster than the overall economy. To really profit from the growth of emerging markets, investors want to be positioned in the sectors pulling GDP forward, not the moribund state-owned enterprises that lag behind or at best, are indirect plays on the commodity cycle. From WisdomTree’s website : (click to enlarge) Technology is the largest sector exposure at nearly 23 percent of assets. Healthcare is underweight, consumer discretionary and consumer staples are the third and fourth largest sectors. Financials are a large portion of assets at about 20 percent, but that is less than many emerging market funds. One reason why the fund isn’t better positioned with respect to sectors is because the fund’s main goal is the removal of SOEs, not a shift in sector exposure. From WisdomTree, the index criteria (emphasis mine): ” State owned enterprises are defined as government ownership of more than 20% of outstanding shares of companies. The index employs a modified float-adjusted market capitalization weighting process to target the weights of countries in the universe prior to the removal of state owned enterprises while also limiting sector deviations to 3% of the starting universe. ” For investors who want to remove SOE exposure while still getting similar sector and country exposure as the run-of-the-mill emerging-market fund, XSOE is a great choice. Assuming the state-owned companies aren’t reformed and unlock hidden value from their assets, over time XSOE should beat the market capitalization weighted competition such as iShares MSCI Emerging Markets (NYSEARCA: EEM ). The case for owning XSOE over other funds is stronger today because the sectors dominated by SOEs are at the center of the slowdown in emerging markets, from China’s debt-laded banks to Brazil and Russia’s energy-heavy stock markets. The fund might lag for long periods when plain vanilla emerging market funds benefit from the sector exposure that SOEs bring, but over the long run, XSOE is likely to come out ahead thanks to holding shares in more efficient firms. Disclosure: The author has no positions in any stocks mentioned, and no plans to initiate any positions within the next 72 hours. (More…) The author wrote this article themselves, and it expresses their own opinions. The author is not receiving compensation for it (other than from Seeking Alpha). The author has no business relationship with any company whose stock is mentioned in this article.