Tag Archives: vanguard

I Love This ETF: Vanguard Emerging Markets Government Bond Index ETF

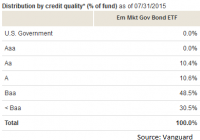
Summary VWOB offers investors exposure to the bond market for government debt in emerging markets. The portfolio has some substantial credit risk, but the yields and duration are solid. When the ETF is combined with other investments in a diversified portfolio, the low correlation is very attractive. I see this as a very solid holding for 3% to 5% of the portfolio. The Vanguard Emerging Markets Government Bond Index ETF (NASDAQ: VWOB ) is a very interesting bond fund. As I’ve been searching for appealing bond funds, I’ve found some of my favorites are from Vanguard. Given my distaste for high expense ratios, it should be no surprise that the Vanguard products would be appealing. After looking through the portfolio, I think the holdings are fairly reasonable for an investor wanting to regularly keep part of their portfolio in a bond fund. However, using only VWOB for bond exposure in a portfolio would be a very unwise decision. VWOB is designed to be an incredible supporting bond fund within a portfolio that already contains other bond investments. Quick Introduction The Vanguard Emerging Markets Government Bond Index ETF is showing a yield to maturity of 5.5% and an average duration of 5.7 years. Given the short duration on the portfolio and the very attractive yield on the bonds, it should be no surprise that the portfolio is carrying a substantial amount of credit risk. The emerging market governments don’t carry stellar credit ratings and there is definitely a material amount of risk in using the bond ETF as an investment. Credit Quality The following chart breaks down the credit quality of the issues being held in the portfolio. Clearly, a substantial portion of the holdings has fairly notable defects in their credit rating; however, the portfolio still offers investors diversification for their portfolio that can be very difficult to acquire in other ways. Emerging Markets and Other The holdings are primarily labeled as Emerging Markets; however, there is also a substantial allocation to a category labeled simply as “Other.” Investors should recognize that areas like Europe have zero allocation in the portfolio. See the chart below: The reason the allocations are so important is this exposure suggests that the portfolio’s correlation with other international bond funds might not be as high. That means even if the ETF is fairly volatile by itself, there could be some very substantial benefits to using it within a highly diversified portfolio that includes equity securities and bond funds allocated to different sectors, regions, and durations. Maturities I grabbed another chart to show the effective maturity on the securities: The maturity profile for the Vanguard Emerging Markets Government Bond Index ETF is fairly reasonable for an investor trying to get a solid diversification across the yield curve. There is a notable amount of exposure to the long-term bonds and the 5- to 10-year range. On the other hand, there is very little exposure to the shortest part of the yield curve. For optimal diversification, an investor may want to include other funds that target the shorter rate part of the yield curve. Risk Measuring returns and statistics since June of 2013 indicates that the portfolio is fairly stable for being invested in emerging markets. The annualized volatility of returns was 5.9%. For comparison, the annualized volatility on the S&P 500 for that period was 11.3% and the annualized volatility for the Vanguard FTSE Emerging Markets ETF (NYSEARCA: VWO ) was 18.3%. Correlation The fund really starts to shine when we consider the correlation in returns between VWOB and other bond funds that the investor might use for a larger portion of their exposure. Look at the correlation matrix below for a comparison: The Vanguard Total International Bond ETF (NASDAQ: BNDX ) is significantly less volatile than VWOB, but the correlation to BNDX is only 28%. BNDX, unlike VWOB, carries a heavy emphasis on Europe, which is entirely absent from the VWOB portfolio. In my opinion, these two ETFs held together in a portfolio are significantly better than either one alone due to the low correlation. Conclusion As far as bond ETFs go, the Vanguard Emerging Markets Government Bond Index ETF is a fairly solid option. An investor that failed to diversify into multiple funds would be taking more risk than necessary to realize returns, but when VWOB is used to enhance the diversification of the portfolio, it is an exceptional ETF. There are only two weaknesses in the entire ETF. One is that the expense ratio of .34% is higher than I want to pay and the other is that the ETF isn’t on the free-to-trade list for Schwab accounts. For investors that have free trading on VWOB through their brokerage and are willing to rebalance their portfolios to take advantage of the low correlations, it would seem that VWOB should be a natural choice for a small portion of the portfolio. My estimate is that the ETF would be a great holding at around 3% to 5% of the total portfolio value. Disclosure: I/we have no positions in any stocks mentioned, and no plans to initiate any positions within the next 72 hours. (More…) I wrote this article myself, and it expresses my own opinions. I am not receiving compensation for it (other than from Seeking Alpha). I have no business relationship with any company whose stock is mentioned in this article. Additional disclosure: Information in this article represents the opinion of the analyst. All statements are represented as opinions, rather than facts, and should not be construed as advice to buy or sell a security. Ratings of “outperform” and “underperform” reflect the analyst’s estimation of a divergence between the market value for a security and the price that would be appropriate given the potential for risks and returns relative to other securities. The analyst does not know your particular objectives for returns or constraints upon investing. All investors are encouraged to do their own research before making any investment decision. Information is regularly obtained from Yahoo Finance, Google Finance, and SEC Database. If Yahoo, Google, or the SEC database contained faulty or old information it could be incorporated into my analysis.
Yes Barrons, Third Avenue Is Going To Do Just Fine

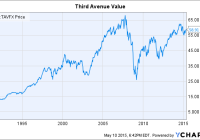
Barrons questions whether Third Avenue can still outperform. Third Avenue has averaged 11.65% since 1990. It has an eclectic portfolio of companies most American investors have never heard of. Barrons recently had a piece entitled ” Can Third Avenue Get Back on Track ?” The answer is Yes. Third Avenue runs a deep value, extremely diversified portfolio that behaves differently from the American financial markets. Third Avenue Value Fund ( TAVFX) was founded in 1990. Over that time frame, it has averaged 11.65% versus 10.45% for the S&P 500. However, over the last ten years, the Value Fund has averaged 4.03% versus 8.01%. TAVFX data by YCharts The Value Fund has names that the average American investor has never heard of: Wheelock (OTCPK: WHLKY ), Pargesa (OTCPK: PRGAF ), Cheung Kong (OTCPK: CHEUF ), Investor AB (OTCPK: IVSBY ), and an eclectic portfolio of other names. There are also bonds, warrants, and other financial instruments. It’s a deep value fund. The goal is to buy stocks that have market caps trading well below net asset value. Third Avenue is looking for what they call a resource conversion. These include spin offs, mergers and acquisitions, special dividends, and leverage buyouts. Here is a link to an article that I wrote two months ago discussing the many investing merits of these companies. This is a style of investing. Like all styles, it has its day. In the late 1990s, deep value was not working. Growth and technology was in vogue. Then the markets crashed in 2001. Over the next few years, Third Avenue was on a roll. Part of this was due to its international holdings. Many of these Asian and Hong Kong based companies beefed up returns and handily outperformed American markets. As the Barrons article notes, there have been some missteps over the last few years. Catalyst Paper and Straits Trading ( OTCPK:STTSY ) were two dogs. What’s working now is everything. Biotech is on a roll. Technology is doing well once again. The NASDAQ has gotten back to where it was trading in the late 1990s. Once again, deep value is lagging. What also is hurting Third Avenue returns is its abundance of foreign holdings. The American dollar has been strong against all currencies and driven down the value of foreign stocks. This won’t last forever. It also has several energy stocks including Devon (NYSE: DVN ), Apache (NYSE: APA ), and Total (NYSE: TOT ). You know how they are performing. Eventually, the global financial markets will pull back, maybe even crash. Third Avenue will go down with it, just like 2001 and 2008/09. Then, it will recover. The question is whether it will recover faster than the S&P 500. Deep value is out of favor. What was hot in the late 1990s is hot now and what is out of favor then is out of favor now. If you want a blue chip portfolio, you should by the Vanguard S&P 500 (MUTF: VSPVX ). If you want something that has stocks that you or your local stock broker can’t find, look at Third Avenue. Disclosure: The author is long TAVFX, APA. (More…) The author wrote this article themselves, and it expresses their own opinions. The author is not receiving compensation for it (other than from Seeking Alpha). The author has no business relationship with any company whose stock is mentioned in this article.

Find The Best Small Cap Value ETF: 3 Tips On Pure Value Style Indexes

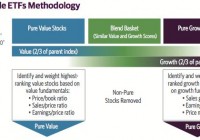
The first key to finding your best small cap value ETF is to understand what “value” means. Unfortunately, there is no industry standard. What is considered value to some companies is growth to others. In 2005, Standard and Poor’s introduced a set of “pure style” indexes. These indexes employ a strict definition of style between growth and value. They also do not have any stock overlap, which is a common problem with traditional style indexes. These indexes are weighted on how much they represent the style. The more a stock represents a small value stock, the more it is weighted in this index, which reduces some of the size bias of the traditional market cap weighting scheme. This graphic from Guggenheim does a great job of showing how a pure style index works: The S&P SmallCap 600 Pure Value Index would be the index to investigate when looking for the best small cap value ETF. Tip #1 – Be ready for increased volatility This index starts with small cap stocks and essentially gets smaller. A traditional small cap index weights the stocks based on their market capitalization, which is the total number of outstanding shares multiplied by the current share price. Bigger companies tend to dominate these indexes. The S&P SmallCap 600 Pure Value Index weights the stocks based on how much of a value they are, which is good if you are looking for value stocks. However, many of the stocks that are at the micro cap level are the biggest value stocks. That moves this index into a much smaller cap environment. This can be seen in the increased volatility of the index. While the S&P SmallCap 600 Pure Value Index has outperformed the S&P 500 Index substantially since its introduction, it dropped 72% in the 2008 Subprime Meltdown versus 51% for the S&P 500 Index. A great index for pure small cap value players, but you need to be able to stand the fluctuation. Tip #2 – Combine pure small cap value ETF with traditional small cap growth ETF If you look closely at the chart from Guggenheim above, you will see that there is an overlap area between pure small cap value and pure small cap growth. If you pair a pure small cap value ETF with a pure small cap growth ETF, you will be missing many of the small cap stocks in the middle. Our historical testing has shown that using a small cap pure value ETF combined with a broad small cap growth ETF is a perfect combination. Our favorite broad growth ETF is the Vanguard Small Cap Growth ETF (NYSEARCA: VBK ). Tip #3 – Use The Guggenheim S&P Smallcap 600 Pure Value ETF (NYSEARCA: RZV ) This is an easy one. Only one ETF follows the S&P SmallCap 600 Pure Value Index, and it is this one created by Guggenheim. Understand that we would still not use it in our small cap satellite portfolio if it did not make it through our vigorous screening process. Originally published on 1/30/14. Updated on 3/2/15. The author is long VBK Are you Bullish or Bearish on ? Bullish Bearish Results for ( ) Thanks for sharing your thoughts. Submit & View Results Skip to results » Share this article with a colleague