Tag Archives: vanguard-total

GMOM: Momentum Swings From Bonds Back To Stocks

Summary GMOM shifted from stocks to bonds in late August, but was too late to protect itself from the summer market plunge. GMOM missed the October snap-back relay in stocks, but has recently repositioned itself to be overweight in equities. The recent whipsaws has not been kind to GMOM, but it may regain its lustre in strongly trending markets. The Cambria Global Momentum ETF (NYSEARCA: GMOM ) is an actively managed ETF that seeks to exploit the momentum factor across different asset classes. Essentially, GMOM invests in the top 33% of a target universe of 50 ETFs based on measures of trailing momentum and trend. Assets include domestic and foreign stocks, bonds, real estate, commodities and currencies. The fund rebalances monthly into ETFs with strong momentum and are in an uptrend over the medium term of approximately 12 months with systematic rules for entry and exit. Seeking Alpha author Left Banker has penned an excellent pair of articles describing the construction of this ETF, and thus these details will not be rehashed here. Instead, this article seeks to highlight the fact that GMOM has just recently switched from a bond-heavy portfolio back into stocks. Locating the previous switch to bonds In his last feature article on GMOM in Feb. 2nd, 2015, Left Banker found that GMOM was broadly diversified across numerous asset classes, with about 46% in equity, 31% in bonds, 18% in real estate (including mREITs) and 6% in commodities. Fast-forward to Nov. 3rd, 2015, and the situation is drastically different. Nearly 94% of the portfolio was in bonds , with the remaining 6% or so in REITs. GMOM holdings on Nov. 3rd, 2015 iShares 7-10 Year Treasury Bond ETF (NYSEARCA: IEF ) 17.56% iShares 3-7 Year Treasury Bond ETF (NYSEARCA: IEI ) 17.12% Vanguard Short-Term Bond ETF (NYSEARCA: BSV ) 17.08% iShares 1-3 Year Treasury Bond ETF (NYSEARCA: SHY ) 12.11% Vanguard Total Bond Market ETF (NYSEARCA: BND ) 10.93% Vanguard Total International Bond ETF (NASDAQ: BNDX ) 6.44% iShares Residential Real Estate Capped ETF (NYSEARCA: REZ ) 6.22% Vanguard Short-Term Corporate Bond ETF (NASDAQ: VCSH ) 6.01% iShares MBS ETF (NYSEARCA: MBB ) 6.00% Total 99.47% As GMOM does not publish its historical holdings, I do not know the exact time that it made the switch from bonds to stocks. However, given the significant underperformance of both U.S. (the SPDR S&P 500 Trust ETF (NYSEARCA: SPY )) and international stocks (the iShares MSCI ACWI ex-U.S. Index ETF (NASDAQ: ACWX )) stocks compared to their respective bond counterparts, the Vanguard Total Bond Market ETF [BND] and the Vanguard Total International Bond ETF [BNDX] over the summer, I infer that change to the better-performing bond ETFs was made sometime during those months. To narrow down the precise timing of the switch further, I compared the total performance of GMOM with SPY and BND over the past three months. We can see that the stock market plunge in late August was acutely felt by GMOM, suggesting that GMOM was still heavily invested in equities at that time. However, GMOM did not track the market fluctuations experienced by SPY in the month of September, nor the snap-back rally in stocks in October. This suggests that the switch from equities to bonds took place sometime at the start of September. We can see from the graph above that while moving to a bond-heavy portfolio protected GMOM from the market gyrations experienced by SPY in September, it also caused GMOM to miss out on the fantastic rally in stocks the following month. This illustrates a general observation: momentum strategies tend to underperform in whipsaw situations. A similar set of circumstances was chronicled for the AlphaClone Alternative Alpha ETF (NYSEARCA: ALFA ), which uses the 200-day MA in order to time its hedges (which is a type of momentum strategy), in my recent article entitled ” ALFA Underwhelms As Hedge Fund Darlings Crater Plus An Untimely Hedge .” From bonds back to stocks Checking the holdings of GMOM a few days later, I discovered that a massive shift had taken place in the constituents of this ETF. The portfolio had shifted from 94% bonds to only 29%. REITs increased from 6% to 17%. Stocks increased from a measly 0% to 53% (70% if you include REITs as stocks). GMOM holdings on Nov. 6th, 2015 iShares Global Tech ETF (NYSEARCA: IXN ) 10.61% iShares Global Consumer Discretionary ETF (NYSEARCA: RXI ) 10.60% Vanguard REIT ETF (NYSEARCA: VNQ ) 10.60% Cambria Shareholder Yield ETF (NYSEARCA: SYLD ) 10.59% iShares Global Consumer Staples ETF (NYSEARCA: KXI ) 10.59% Vanguard Total Stock Market ETF (NYSEARCA: VTI ) 10.57% PowerShares Emerging Markets Sovereign Debt Portfolio ETF (NYSEARCA: PCY ) 10.56% Vanguard Total International Bond ETF BNDX 6.43% iShares Residential Real Estate Capped ETF REZ 6.17% Vanguard Short-Term Corporate Bond ETF VCSH 6.02% iShares MBS ETF MBB 6.00% Total 98.73% The recent change in the portfolio is also shown graphically below. Obviously, the recent move back into equities is a direct consequence of the ferocious rally in the stock market over the past month and a half. With stocks knocking again on the door of all-time highs, one has to ask the question, is this really the best time to be overweight equities? If you answered “yes” to that question, then you are likely a momentum investor, and GMOM might be an ideal fund for you. If you answered “no,” you would do well to sell GMOM now that it has shifted again back into stocks (and you should also ask yourself why you were invested in this fund in the first place?). Summary The recent whipsaws in the stocks, and to a lesser extend bond, market has not been kind to a momentum fund such as GMOM. Indeed, while having performed comparably with U.S. and international stocks and bonds in the first six months or so of its lifetime since inception, it now trails all four major asset classes by a wide margin. If this whipsaw behavior were to continue, GMOM will likely continue to underperform. On the hand, strong trending markets (both bull and bear) in various asset classes should allow GMOM to focus on what it does best: exploiting the momentum premium. GMOM Total Return Price data by YCharts For more information about other momentum ETFs, see my previous articles ” Comparing 4 Tactical/Momentum ETFs ” and ” An Update On 4 Tactical/Momentum ETFs “.
VTI: Who Cares About The Middle Class?

Summary New legislation that may curtail unpaid overtime has been introduced. The P/E ratio of the market is at moderately high levels but the E (earnings) relative to GDP is extremely high. A shift to higher income for labor would be a negative short term catalyst but may be necessary for long term economic health. I’m preparing for the shift by buying less broad/total market funds and more equity REITs. While the turmoil in Greece has been capturing the headlines, there are other issues that may hit much closer to home. I’ve been a fan of indexing the market and riding out the bumps through dollar cost averaging. I believe American investors can be served well by using a diversified index like the Vanguard Total Stock Market ETF (NYSEARCA: VTI ). Even as an analyst, I combine VTI with equity REIT ETFs as the major source of value in my portfolio. I believe in using the index as the main holding and attempting to build around it rather than attempting to individually pick every stock. While VTI is delivering an excellent expense ratio (.05) and excellent diversification (3827 holdings), it is still subject to market risk. I am concerned that we may be nearing a market top for the broad equity market and I am shifting my portfolio to a heavier concentration of equity REITs. Because I believe shorting the market is the game of fools, I would never recommend it. However, I do think the risk/return proposition favors equity REITs. The Middle Class There is a common refrain about the disappearing middle class. I must admit that I do believe over the next decade we may see a further increase in the gap between the “Haves” and the “Have Nots”. In my opinion, the market is far less attractive without consumers to buy the crap on the shelves. Background It helps to remember that the market can still be viewed by running numbers on the S&P 500 which makes up a very substantial portion of VTI. The following chart, built with data from multpl.com, shows the P/E ratios for the S&P 500 over a very long time frame. (click to enlarge) You might notice that we are currently right around the trend, but that is a very serious problem when we consider that earnings are exceptionally high as seen in the chart below: (click to enlarge) Corporate profits after taxes are hitting staggering values by historical measures. I believe a major factor in the high corporate profits is the introduction of more automation and a lack of intense competition in some sectors. One sign for weaker competition is buybacks. When companies are spending their cash on repurchasing shares there is an improvement in the P/E ratio and there is a fundamental increase in the shareholders ownership of the assets, but there is no increase in productivity capacity. A lack of new capacity leads to weaker competition which protects profit margins. If you need to see what high capacity and intense competition looks like, simply research companies in the mining sector. Earnings, ore prices, and share prices have fallen dramatically due to the intense competition. If corporate profits after tax were to revert to a more historically normal level as a percentage of GDP without enormous growth in GDP, it would lead to much lower earnings. Those lower earnings in turn would lead to lower share prices unless the P/E multiples increased significantly. The Headwind for Earnings The White House recently released a fact sheet on some proposed new legislation that would significantly expand the number of workers eligible for overtime pay. Nearly five million workers would be covered and this could set up quite a bit of political sparring. If nothing else changed and the companies simply paid the overtime that is currently avoided through “salaried” compensation, the simple result would be increases in labor expenses and compressed profit margins. At the same time, I would expect increased levels of sales as more money would go to middle class and lower class workers with a high propensity to consume . In short, the money would go into their pockets and then into the cash register at another establishment. Companies Won’t Agree I expect to see some fairly substantial lobbying efforts spend to fight or minimize this bill because the cost of purchasing congressmen and senators is cheaper than the cost of paying overtime to low-wage salaried employees. Was that too blunt? I’d rather get the point across clearly. The legislation is designed to raise the level of salary required to keep an employee exempt. The reason it is important for the long term health of the economy is that the current level is at less than $24,000 per year. By labeling employees as exempt, companies are able to work the employees for overtime that can drive their effective wage rate below minimum wage laws while claiming that the employees are “managers”. To the extent that this encourages companies to simply hire more employees for regular schedules, the change could be positive by improving employment rates and revitalizing a struggling middle class. However, it wouldn’t happen without pain. While the sales would be expected to increase, the weaker margins would compress earnings and I would expect share prices to fall. For VTI, that could mean share prices dropping as low as $90 in a bearish scenario (about a 15% pull back). Long Term I believe the long term implications would be very positive as it would improve employment prospects for many struggling families so a significant pull back would become a great buying opportunity. Without growth in the middle class, I think the growth in EPS from repurchasing shares may become unsustainable because earnings still depend on sales and sales still require consumers that can afford the products. In the short term, growth by repurchasing sales is fine. Over the long term, it fails to provide new productive (physical) assets that generate the wealth that we consume as humans. Seeing an end to unpaid overtime through the guise of “salaried” work would be a short term negative catalyst for stock prices, but it may be necessary for a healthy economy. I’m preparing by shifting more of my purchases into the REIT sector where I expect strong income to translate into higher average rents. I’m reducing my purchases of the broad U.S. market, to the acquisitions made by my dollar cost averaging in an automatic retirement account. How will you prepare? Disclosure: I am/we are long VTI. (More…) I wrote this article myself, and it expresses my own opinions. I am not receiving compensation for it (other than from Seeking Alpha). I have no business relationship with any company whose stock is mentioned in this article. Additional disclosure: Information in this article represents the opinion of the analyst. All statements are represented as opinions, rather than facts, and should not be construed as advice to buy or sell a security. Ratings of “outperform” and “underperform” reflect the analyst’s estimation of a divergence between the market value for a security and the price that would be appropriate given the potential for risks and returns relative to other securities. The analyst does not know your particular objectives for returns or constraints upon investing. All investors are encouraged to do their own research before making any investment decision. Information is regularly obtained from Yahoo Finance, Google Finance, and SEC Database. If Yahoo, Google, or the SEC database contained faulty or old information it could be incorporated into my analysis.

Vanguard Diversified Portfolios: How To Use Vanguard’s Best Diversified ETFs

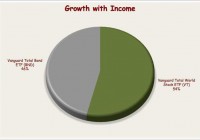
Originally published on Jan. 26, 2015 Vanguard Diversification With 4 Easy-to-Copy Portfolios Vanguard ETFs and Index Funds are the optimum vehicles for creating a globally balanced portfolio. With just a few holdings, you can have exposure to thousands of stocks and bonds from around the world. One of the primary ways to create good diversified portfolios is to use vehicles that track an index. Vanguard started the first index fund and their ability to track an index is legendary. Another advantage of tracking an index is the lower cost of not having to pay for an expensive manager who often falls behind an index even without the higher cost. Vanguard is the low cost leader and it keeps getting cheaper. The amount of money invested in Vanguard Funds is growing rapidly. The more money a fund has, the more efficient its cost structure, and because Vanguard is run like a credit union they keep passing along their savings. This creates a fee-lowering circle. A lower fee attracts more money to the funds, which then keeps the fees dropping. I have researched the Vanguard ETFs list and will present Vanguard’s best diversified ETFs for a two, three, four or five position Vanguard ETF globally balanced portfolio. Examples: Vanguard Diversified Portfolios Using the Best Diversified ETFs I will present a portfolio for each mixture that is made using the Efficient Frontier and the Black-Litterman model. I will target each portfolio at approximately 60% of the risk of the S&P 500 Index (0.60 Beta). I call this type of portfolio my Growth with Income portfolio. See “How to Make an Investment Portfolio: 6 Steps to Better Investing” for a full understanding of how to make the best index portfolio. Best Vanguard Diversified Portfolio with Two ETFs – Using Vanguard’s Best Diversified ETFs Vanguard Total World Stock Index ETF (NYSEARCA: VT ) or (MUTF: VTWSX ) – This Vanguard Total World Stock review starts with the very low expense ratio. With an expense ratio of 0.18%, this fund tracks the FTSE Global All Cap Index, a market-cap weighted index of global stocks covering 98% of the developed and emerging market capitalization with approximately 7,240 large-, mid-, small-, and micro-cap stocks located in 50 countries. This fund employs a sampling method and currently owns 5,351 of the stocks from this index. However, this Vanguard world stock ETF does not hold exposure to frontier markets. Vanguard Total Bond Market ETF (NYSEARCA: BND ) or (MUTF: VBTLX ) – This fund is at the top of the Vanguard bond ETF list, providing superior inexpensive U.S. bond coverage. With an expense ratio of 0.08%, BND tracks the Barclays U.S. Aggregate Float Adjusted Index. It covers a wide range of public, investment-grade, taxable bonds in the United States-including government, corporate, and international dollar-denominated bonds, as well as mortgage-backed and asset-backed securities- all with maturities of more than one year. The ETF invests by sampling the Index and currently holds 6,166 bonds. BND does not provide exposure to ultra-short, high yield or TIPS bonds. (click to enlarge) Pros If we had to vote for one ETF on our Vanguard Best ETF Index Fund List, this Vanguard World ETF would be it. This extremely efficient, low cost, Vanguard all-in-one fund, world ETF covers 98% of the developed and emerging markets capitalization. Many other portfolios have considerable turnover, and trading as stocks migrate from one asset class to another. For example, a stock in your portfolio may move from your mid-cap ETF to your large-cap ETF simply because the market cap changed. You still own the company, but internal trading costs were increased with possible tax consequences when the stock moved. A global total market ETF, such as VT ETF, greatly reduces the stock migration costs because the stocks do not need to change ETFs. BND offers the same great broad coverage of U.S. bonds. With just two holdings, which you can purchase for free in a Vanguard Brokerage account, you will own 5,351 stocks and 6,166 bonds with a blended expense ratio of only 0.13%. Cons The first downside to this two-part portfolio is the lack of flexibility. The best index portfolio would have more ability to control the overall risk of your portfolio. You have no way to control the amount or types of the stocks or bonds in your portfolio. For example, you cannot add more small cap stocks or long-term bonds if you think these are needed. The main disadvantage of this portfolio is the lack of international bonds, which make up roughly 35% of the world’s capitalization of stocks and bonds. Generally, money moves unpredictably from asset class to asset class. If you have a big hole in your portfolio you will have periods of under performance. Best Vanguard Diversified Portfolio with Three ETFs – Using Vanguard’s Best Diversified ETFs Vanguard Total World Stock Index ETF ( VT ) or ( VTWSX ) – See details in previous portfolio. Vanguard Total Bond Market ETF ( BND ) or ( VBTLX ) – See details in previous portfolio. Vanguard Total International Bond ETF (NASDAQ: BNDX ) or (MUTF: VTABX ) – With an expense ratio of 0.20%, this fund tracks the investment-grade Barclays Global Aggregate ex-USD Float Adjusted RIC Capped Index (USD Hedged). The Index includes government, government agency, corporate, and securitized non-U.S. investment-grade fixed income investments, all issued in currencies other than the U.S. dollar and with maturities of more than one year. To minimize the currency risk, the ETF will attempt to hedge its currency exposures. The ETF currently holds 2,246 bonds. BNDX does not include ultra-short, high-yield or TIPs international bonds. (click to enlarge) Pros Incredibly, with just three very efficient, low-cost ETFs you can hold 5,351 stocks and 8,412 bonds. Stock and bond migration costs are low to non-existent in this mixture of ETFs. You now have nearly full exposure to U.S. stocks and bonds as well as international stocks and bonds. The weighted average cost of this vastly diversified portfolio is only 0.18%, which is significantly cheaper than the average Mutual Fund at 1.27%, the average Index Fund at 0.74% and the average ETF at 0.61%. Cons These are market-cap weighted indexes, which means that mid and small cap U.S. stocks and emerging markets will not have as much impact on the portfolio as the large cap stocks. The ability to really fine-tune risk is limited with only three ETFs. In 2003, I implemented this portfolio with my 600 asset management clients. The portfolio did fantastic. The clients hated it. I had so many clients leaving that I had to abandon the concept after only one year. When they got a statement for the accounts that held their life savings and all they saw were three holdings from the same company, they got extremely nervous. We actually printed out, in book form, an entire list of all of the holdings to demonstrate the extreme diversification. We were confident that these clients had never been more diversified at any point in their lives, but they still left in droves. For some investors, three is just not enough. Best Vanguard Diversified Portfolio with Four ETFs – Using Vanguard’s Best Diversified ETFs Vanguard Total Stock Market ETF (NYSEARCA: VTI ) or (MUTF: VTSAX ) – With an extremely low expense ratio of only 0.05%, this ETF tracks the CRSP US Total market Index, which represents approximately 100% of the investable U.S. stock market and includes large-, mid-, small-, and micro-cap stocks. This ETF invests by sampling the Index, and currently holds 3,657 stocks. See “Sample Vanguard ETF Portfolio: 4 Ways to Cover U.S. Stocks” for additional methods of covering the U.S. stock market. Vanguard Total International Stock ETF (NASDAQ: VXUS ) or (MUTF: VTIAX ) – I consider this fund the overall best international stock ETF. With an expense ratio of just 0.14%, this Vanguard International ETF tracks the market-cap weighted FTSE Global All Cap ex US Index, which covers 99% of the world’s global market capitalization outside the US. This Vanguard International Stock Index holds 5,512 large-, mid-, small- and micro-cap stocks from 46 developed and emerging markets. This ETF does not cover the frontier markets. Vanguard Total Bond Market ETF ( BND ) or ( VBTLX ) – See details in previous portfolio. Vanguard Total International Bond ETF ( BNDX ) or ( VTABX ) – See details in previous portfolio. (click to enlarge) Pros With just four low-cost ETFs you can hold 9,169 stocks and 8,214 bonds. Stock and bond migration costs are low to non-existent, and this mixture has a fairly good ability to add or subtract risk. The number of stocks is greatly increased versus the three part portfolio, and the split of U.S. and International stocks provides some opportunity to make money from rebalancing. The blended average expense ratio is a very low 0.10%. Cons Although the diversification is extreme, some investors may still shy away from investing considerable money in just four holdings. Adding ETFs for ultra-short, high yield or TIPS bonds or frontier market stocks, which is not covered in this portfolio, may make these investors more comfortable. Best Vanguard Diversified Portfolio with Five ETFs – Using Vanguard’s Best Diversified ETFs Vanguard S&P 500 ETF (NYSEARCA: VOO ) or (MUTF: VFIAX ) – With an expense ratio of 0.05%, this ETF tracks the wildly popular market-cap weighted S&P 500 Index. The ETF fully replicates the Index and is dominated by the stocks of large U.S. companies. Vanguard Extended Markets ETF (NYSEARCA: VXF ) or (MUTF: VEXAX ) – With an expense ratio of 0.10%, this ETF tracks the market-cap weighted S&P’s Completion Index. This index contains all of the U.S. common stocks regularly traded on the New York Stock Exchange and the Nasdaq over-the-counter market, except those stocks included in the S&P 500 Index. The ETF uses a sampling method to replicate the index and currently holds 3,078 stocks. Vanguard Total International Stock ETF ( VXUS ) or ( VTIAX ) – See details in previous portfolio. Vanguard Total Bond Market ETF ( BND ) or ( VBTLX ) – See details in previous portfolio. Vanguard Total International Bond ETF ( BNDX ) or ( VTABX ) – See details in previous portfolio. (click to enlarge) Pros Using this mixture of ETFs allows you to fine-tune your risk level by controlling your exposure to mid and small cap U.S. stocks, while including coverage of international stocks and bonds. These five ETFs give you exposure to 9,090 stocks and 8,214 bonds. This portfolio has a low blended expense ratio of 0.10%. I found that this was a very popular portfolio. Investors liked at least five holdings, and although the S&P 500 is included in the all of the previous portfolios, there was more comfort in seeing it directly in the portfolio. Having more parts in the portfolio increases the possibility of rebalancing gains, especially if you do not have to pay capital gains taxes by using a tax-deferred account such as an IRA. The commissions are free, which can be accomplished in a Vanguard Brokerage account. Cons Stock migration costs will be higher when you divide the market into small pieces. Disclosure: Author has holdings in BIV, BLV, BND, BNDX, BSV, IJS, IXP, JKL, RYU, RZV, SCV, VBK, VIG, VOO, VPU, VTI, VWO, VXF, VXUS, XLU.