Tag Archives: undefined

Capital Power Corp.: Weak Market Sentiment But Strong Investment Case

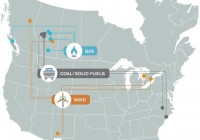
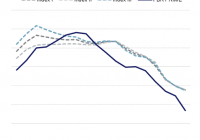
Summary Strong hedges help protect Capital Power from temporary power price weakness in their key market. Strong future growth is expected as new production comes on line, and older coal assets in the province are retired. The market is penalizing Capital Power due to weak electricity prices, weakness in the oil-centric Alberta and political party changes, but all represent temporary issues. New course issuer bid, recent DRIP suspension, coming dissolution of EPCOR’s ownership and low energy prices allow purchase of a solid Canadian Independent Power Producer at a discount. Capital Power Corporation ( OTC:CPXWF ) is an independent power producer (IPP) based in Edmonton, Alberta, Canada. With more than 3,100 MW of power generation capacity through 16 facilities, 371 MW via a Purchase Power Agreement (PPA) and 620 MW of owned generation in development (mostly in Alberta and Ontario) Capital Power is one of the largest IPP’s in Canada, with one of the lowest payout ratios in the industry. Its operations and type of generational facilities are listed in the graphic below: (click to enlarge) Source: Capital Power IR Business Model Capital Power generates electricity and sells that production to local utilities, generally based on contracts with local utilities (Purchase Power Agreements, or PPAs) to lower the operating risks of the business model, and can hedge the production that is sensitive to local market conditions. They also generate and sell non-contracted electricity to drive cash flow and allow it an avenue for growth after entering contracts to cover capital costs and their dividend. Due to weaker than expected demand, warmer weather and a recent increase in supply, the market has been generally weak, allowing Capital Power to trade at levels not seen in some time. With approximately 50% of its 2016 power production hedged at relatively attractive prices, and long-term power agreements for up to 20 years for most of the required capital and dividend costs, Capital Power is suffering under the weight of headline issues, rather than in line with its impressive business fundamentals. With strong operating availability (98% in Q1) and minimal unplanned outages they have been firing on all cylinders lately. Their strong hedges have largely negated the impact of temporarily low Alberta power prices, allowing them to continue towards their FFO guidance of $365-415M. They also recently announced a 5 million share course issuer bid approval by the Toronto Stock Exchange (TSE) and cancellation of their DRIP (eliminating dilution at these low prices). So what is going on with the share price? New Democratic Party (NDP) As a resident of the neighboring province, and closet environmentalist, my siblings and I had a lively discussion regarding this recent development. The provincial NDP, a left-of-center political party, managed to win a majority in the Alberta election. This was to the dismay of almost every major Alberta-based company (and almost every rural resident), as it had long been the friendliest province in Canada (or State in all of North America) to develop oil properties. With low tax rates, strong inflows of qualified workers and lax environmental rules, it was the nearly perfect place to set up shop. This all changed on Election Day. The NDP immediately changed the game with overdue (in the author’s opinion) changes to environmental rules (increase carbon emission taxation), higher taxes on the highest income tax brackets, and a “review” of the royalty policies in Alberta. This has raised some questions regarding the future of business development in Alberta, but I feel these are overblown for a few reasons: Oil is Alberta’s bread and butter – The NDP is excited to finally begin to enact proper environmental regulations in Alberta, but even if they make aggressive moves, they are still playing catch-up to every major state in North America. They will need to push the envelope to an extreme degree to stop being the premier place in Canada (and the Americas) to do business. Taxation Changes are reasonable – The next place in Canada to do business in oil is Saskatchewan, and the effective tax rates are nowhere comparable. There is little fear of businesses relocating anytime soon. A few folks mention relocating to Texas, but Canadian corporate taxes are still very low, and Calgary remains one of the main hubs for oil companies in the Americas. Carbon Tax Fears Overblown – Capital Power, for example, is welcoming the new environmental regulations. The party line is that this is due to their being forward thinking, but when it comes down to it these regulations are going to happen sooner or later. Even the increases announced are almost comically below what is required. Capital Power is actively selling carbon tax offsets from its renewable generating plants. Using these offsets for the Alberta increases (which phase in slowly over time) is not a major business issue for the amount of cash generated by their business, allowing them to postpone any FFO impact until 2020. Perception Change is an Overreaction and Temporary – Arguably the biggest effect was the worry that the change in provincial leadership would result in a massive perception switch within the province. This might be a concern, but Alberta was growing quickly not only because it was business friendly but also because it houses all of the resources. Alberta is holding all the cards. If you want to develop, you follow the rules, and even the changes made so far are well below the required amounts to start actually affecting business decisions. EPCOR relationship EPCOR is a utility company owned by the City of Edmonton, which previously owned Capital Power and spun it off to become its own independent power company. As EPCOR has committed to reducing its stake in the power company to focus on its own operations, it has been actively lowering its ownership in Capital Power since the IPO. Recently, they issued $225M in a secondary offering that lowered EPCOR’s stake in the company to 9% (from 18%). The entire ownership stake is now common shares. Capital Power is also no longer obligated to assist EPCOR in making secondary offerings. With the elimination of the agreement (Registered Rights Agreement) EPCOR plans on selling the remaining interest as market conditions and capital requirements apply. This eliminates a large and ongoing weight on the stock, as they have been slowly unraveling their position through selling and secondary offerings. Source: Q1 Presentation By eliminating this overhang, the public float is now maximized and there is no large third party encouraging equity issuances or selling off their position. Once this ownership is completely done, the stock will lose that unnecessary selling pressure. I feel the time to capitalize is at this moment, rather than awaiting completion, due to weakness from temporary overhangs on the stock from other areas and that the final announcement of EPCOR’s ownership stake going to zero could be a small boon for the company share price in the future, but investors need to be playing the stock first to see that benefit. Power Prices Power prices are very low at the moment, coming in below expectations in Alberta specifically. US power prices have been strong lately, but with so much of its production in Alberta this has an outsized impact on Capital Power. Power prices are being pushed from two sides. Temporarily Lower Demand Alberta has been suffering from lower oil prices, which has been reducing industrial demand. There was a stall in internal load growth in April, but that has reversed as of May, and is expected to continue growing, estimated at approximately 4.4% for the next 5 years: (click to enlarge) Source: Capital Power June Investor Meeting Temporarily High Supply With their newest power plant facility coming online, Capital Power influenced power prices with its incremental power production, though they largely hedged that production for this year. Due to the temporarily lower demand, the 1200MW of generation projects for 2015 are influencing the supply picture. However, there are legislated retirement dates for coal fired plants that will begin to ramp up over the coming years. This is detailed in the graphic produced by Capital Power: (click to enlarge) Source: Capital Power April Investor Meeting This gives a reprieve to the existing suppliers and will remove a supply overhang. The continual construction is in preparation for this eventual decrease in supply, and will result in temporary, and expected, pressures on prices. Valuation To complete this analysis I used data from YCharts and the company’s reported financials. There is a discrepancy between the reported Enterprise Value between the two. In the comparative analysis I utilized their reported values, whereas in the evaluation of Capital Power to its historical prices, I utilized YCharts (as we can assume they calculate it the same way each year). Relative to Competitors Capital Power is currently trading at an EV/EBITDA ratio of 9.98, 84% of its production locked into PPAs for 2016, and 50% of its production hedged at stronger rates and a MW growth rate of 20%. This compares to its competitors rather interestingly. Atlantic Power (NYSE: AT ), a “clean energy” producer (mostly natural gas, no coal) trades at 8.87, has 69% of 2016 production in PPAs, no active price hedging and MW growth of about 3%. Northland Power ( OTCPK:NPIFF ), a relatively clean energy producer (much heavier weight to renewables, no coal) trades at 15.83, has 100% of its production in PP’s, and a MW growth rate of an impressive 48%. Transalta (NYSE: TAC ), a relatively dirty producer (lots of renewable like Capital Power, but higher coal production of 56% versus Capital Power’s 47%) trades at 8.86, has 80% of production in PPAs in 2016, and a MW growth rate of 24%. We can presume that Capital Power should trade at some higher multiple than its low growth, highly leveraged competitor Atlantic Power, and the dirtier cousin Transalta, but is a 12% premium all that’s called for? With its better hedged production, strong growth profile and clean energy credits (allowing it to avoid negative FCF implications of NDP policy changes to 2020) there seems to be little reason to value Capital Power so closely to the listed competition. To see how much we should value Capital Power, we go to historical valuations. Relative to History Utilizing YCharts for the data, we get an average Enterprise Value (EV) of approximately 3773M (for 2015, it is 3085M, compared to a 4182M reported by Capital Power itself). We can then use the Funds from Operation (FFO) generated by the business over the last 5 years to arrive at an EV/FFO multiple of 9.76 that Capital Power historically trades at. Compare this to the existing EV/FFO multiple for 2015 of 7.36 and we arrive at a price target of approximately $29.12, or a return of 32.6%. With a 6% dividend policy, we arrive at a 38.8% total return to year end. Note we assume that increases in the EV will translate into a proportionate increase in share price, as all other values stay constant. To evaluate possible downside, we will use a close comparable. Transalta is the closest of the comparable competitors with similar growth rates, Alberta-heavy assets, large dividend policies, large proportion of “dirty” production and they generally trade in relation to each other. Utilizing the same method of valuing Transalta, we arrive at a five-year average EV/FFO of 11.39. Currently trading at 9.10, we can see that Capital Power trades at a discount to this 5-year relationship by approximately 5%. This brings us a worst-case 5% return as Capital Power approaches parity with this relationship with Transalta. With a 6% dividend we arrive at an 11% return by year end. Again, this is assuming only matching the very low price that Transalta trades at currently, while keeping the historical relationship intact. Risk & Mitigating Factors Hedges Drop Before Prices Recover – Strong hedges are protecting earnings, but they are temporary in nature. A continued downturn in Alberta will begin to affect FFO materially in 2017. To mitigate this risk, Capital Power does have hedges out to 2017 but they believe (and I agree) that prices should show improvement as we approach the end of 2016. A strong improvement in the underlying economy of Alberta is vital to improvement of energy prices. Oil Price Weakness – Collapse in oil prices will affect Capital Power more than most energy producers due to its reliance on the province of Alberta for the majority of its revenue. Alberta is handling the crises better than most expected, but continued low oil prices will put a damper on growth in the region. Capital Power has tremendous financial resources to continue to expand to additional markets, and the capital flexibility to weather low energy prices for some time while awaiting a recovery. NDP Royalty Review – Should the political party change the oil revenue policies to something closer to market, it may further shift investor sentiment against Alberta based companies. In the author’s opinion, it is an increase that is long overdue, but even a marginal change will have an outsized impact on market sentiment. I believe it is unlikely the review results in material changes at this time, due to the extreme circumstances related to oil price weakness, but there is always the risk. Potential Catalysts EPCOR’s Ownership Stake Reduction – As their stake reduces to zero, it will remove a significant overhang on the stock as it removes a major, continual seller/diluter of stock prices. The announcement of EPCOR’s stake reducing to zero should be a boon to the equity price. NDP Policy Shift – As the NDP continue to adapt to their new role they may reduce the pressure on oil and gas companies, allowing investors and executives time to adapt to their new leadership style. There is likely to be a significant decrease in announcements related to oil and gas as most of the policy changes influencing them are currently in progress. Less noise will go a long way in easing investor anxiety regarding this new political change. Market Begins to Put Changes in Perspective – As I have mentioned in the article, there is little reason to fret about the changes made to Alberta’s energy policy changes. They are relatively weak and will do little to influence business practices. Capital Power will only begin to feel the changes in 2020, once their carbon credit offsets finally do not cover the new policies. Oil Price Recovery – Recovery in oil prices are a boon to any Alberta-based stock, regardless of their activity in the oil sands. Capital Power sells a lot of energy to the industrials within the province, so any increase or stabilization of oil prices will help boost demand in the region, strengthening current power prices. Conclusion Trading at historically low multiples, with strong PPAs, well-timed hedges, and a well-covered 6.19% dividend yield, Capital Power is sitting at a very interesting entry point. As investor sentiment overreacts to the latest news and the temporary overhangs on the industry, Capital Power gives investors access to one of the best-regulated power jurisdictions in North America. Investor sentiment may temporarily wreak havoc on the price of Capital Power, it does not influence the underlying value of the company. With solid downside protection, strong potential upside and an impressive dividend, Mr. Market is granting investors a significant margin of safety in a conservative asset class. This may represent a solid opportunity to add exposure to the Alberta energy market at a significant savings for the high-yield portion of an investor’s portfolio. Editor’s Note: This article discusses one or more securities that do not trade on a major U.S. exchange. Please be aware of the risks associated with these stocks. Disclosure: I/we have no positions in any stocks mentioned, but may initiate a long position in CPX over the next 72 hours. (More…) I wrote this article myself, and it expresses my own opinions. I am not receiving compensation for it (other than from Seeking Alpha). I have no business relationship with any company whose stock is mentioned in this article. Additional disclosure: This stock trades with narrower spreads on the Toronto Stock Exchange (TSE) those considering purchase should consider this option, if available through your broker. The author is not a financial advisor, please conduct your own due diligence and consult a trusted financial advisor before making any financial decision.

Everyone Should Consider These Crisis-Immune Stocks

Summary After six years of rising share prices in the United States, I start to feel a little uncomfortable with current valuations. In this article I try to find out which companies and industries are likely to do well when the going gets tough in financial markets.. I calculated the share returns of American S&P 500 companies and European Stoxx 600 companies and industries during the financial crisis in 2008. I intend to increase the weights of stocks in my portfolio that are active in defensive sectors like consumer staples, health care, utility and energy. Readers can look for their own crash-resistant company in a spreadsheet list that is provided at the end of the article. My dilemma is simple. Professor’s Jeremy Siegel’s plea that stocks are the best asset class to own in the long run is very convincing (please read his brilliant books Stocks in the long run and The Future for Investors ). However, at the current valuations I strongly believe long run future returns will be low single digit at best for the S&P 500 as a whole, see this previous article of me. The simple answer to this dilemma is that I should look for the right stocks. I argued in earlier articles that I like to invest in companies that have their earnings protected by a wide moat such Wal-Mart (NYSE: WMT ), Nestlé ( OTCPK:NSRGY ) and Unilever (NYS: UN ). In my view these companies will be able to generate handsome returns despite above average valuations, because they can invest every dollar they retain out of profits in a very lucrative way. In previous articles, I reasoned that investors should ignore short term price fluctuations if they are convinced the earnings power – that is the possibility to reinvest retained earnings in a lucrative way – has not changed. As long as the sustainable competitive advantage of the company – or what super investor Warren Buffett calls a moat – is unaltered, there is absolutely no reason to sell your shares. This point of view makes perfect sense in theory. In practice when shares plummet day after day and everybody thinks the end of civilization is near, it is extremely difficult to assess the long term earnings power of a company. Therefore, the purpose of this article is to find companies that are great investments and tend to do well when things get tough in financial markets. Forget useless math If have read dozens of (academic) papers and books on the concept of risk. The trouble is that most of the metrics used in finance – think volatility, beta, Value at Risk, etc – are close to useless in the real world because they explicitly or implicitly assume share returns are distributed according to a so called normal distribution (almost all the returns are close to the average). In the real world investors are faced with outliers, or returns that are light years away from the average. Although the academic world tries to construct models that try to deal with outliers, the approach I use to capture risk of individual shares in this article is extremely simple (the way I prefer things to be). I calculated the returns of stocks in particular sectors and individual stocks in the United States and Europe from top to bottom during the credit crisis. To be honest, the saying ‘financial markets have no memory’ seems applicable to me. I was a little shocked by the returns that were spitted out by my Bloomberg terminal doing the analysis. In the credit crisis the S&P 500 and Stoxx 600 – the 600 biggest European companies by market capitalization – lost 55.2 percent and 58.2 percent respectively of their value from top to bottom during this period. Stomach this! Stocks lost more than half of their value during the credit crisis Index Top Bottom Total Return S&P 500 index 10-9-2007 9-3-2009 -55.2% Stoxx 600 1-6-2007 9-3-2009 -58.2% Source: Bloomberg. Nowhere to hide I suspect that most readers are familiar with the story about the statistician who drowned in a lake with an average depth of six inches. Averages can be dangerous as the distribution around the average can be wide. Therefore, I grouped the companies in industry segments to see how each segment reacted during the crisis. I use the Global Industry Classification Standard (GICs, you can find which industry group belongs to which sector on this wiki page). Which American industry did best and worst during the credit crisis? Returns of S&P 500 Companies Returns of Stoxx 600 companies Sector # Mean Rec. return Sector # Mean Rec. return Consumer staples 33 -33,1% 49,4% Energy 23 -32,7% 48,5% Health care 50 -39,1% 64,3% Health care 36 -33,9% 51,4% Utility 29 -40,9% 69,3% Telecom services 19 -35,2% 54,3% Energy 37 -49,2% 96,8% Consumer staples 44 -36,8% 58,3% Materials 26 -50,5% 101,9% Utility 25 -38,8% 63,3% Information technology 62 -51,2% 105,1% Materials 48 -50,3% 101,1% Consumer discretionary 77 -53,6% 115,4% Information technology 27 -52,3% 109,7% S&P 500 -55,2% 123,3% Industrials 111 -54,7% 120,6% Industrials 60 -55,8% 126,0% Stoxx 600 -58,2% 139,0% Telecom services 6 -56,3% 129,0% Consumer discretionary 81 -60,1% 150,7% Financials 86 -68,1% 213,4% Financials 121 -64,6% 182,1% Source: Bloomberg. Return represents total shareholder return, including dividends. # represents the number of companies within each sector. Recovery return is the return necessary to recover your initial investment. Given the nature of the last big crisis I suspect few readers will be surprised by the worst performing sector: financials. Financial companies lost a staggering 68.1 percent in the U.S. and 64.6 percent in Europe of their market value from top to bottom. Note that in some cases the investors had to deal with the worst thing that could happen to a value investor: a permanent loss of capital. For example Lehman Brothers went bankrupt and both Bear Stearns (JP Morgan) and Wachovia (Wells Fargo) were absorbed by other investment banks. It is good news for investors that the top performing sectors are also fairly similar on both sides of the ocean. The sector consumer staples (mainly food, beverages, tobacco and personal products), Health care (equipment, pharmaceuticals and biotech), Utility and Energy are all represented in the top five in both the U.S. and Europe. The average returns of these sectors are all above the average of the market. Do not get me wrong: the performance was still horrible. This was the scary thing of the credit crisis: every share and asset class – even gold! – collapsed due to the a complete loss of faith in the financial system. But – and this is in my opinion very important – even in the credit crisis it still mattered a lot if the value of your portfolio dropped by 33 percent (fully invested in consumer staples), 55 percent (invested in the index) or 68 percent (fully invested in financials). Let’s do the math. If the value of a portfolio drops by 33 percent an investors needs a return of about 50 percent to get back to where he or she started. But if you lost 55 percent or 68 percent of value an investor needs a return of respectively 123 percent (factor 2.5) and 213 percent (factor 4.3!) to recover you initial investment value. You find the ‘recovery returns’ of each individual sector in the table above. As a side note I like to inform you that I also examined the returns of each industry in the aftermath of the burst of the internet bubble in 2000 in both the U.S. and Europe. In that period the same defensive sectors outperformed the market (most of these sectors even realized positive returns as the loss in market capitalizations was concentrated in internet companies). A quest for cheap crash proof stocks After a 6 year period in which markets have treated us well – again leading to expensive stocks – it makes sense to me to increase the weights in my portfolio to stocks that tend to do well in downturns. Therefore, I am looking for stocks that are active in the consumer staples, health care, utility and energy sector. However, although I favor the simple over the complex, there is always the risk of taking too many shortcuts. An investor always runs the risk that stocks that were resilient in 2007 will prove to be horrible investments during the next crash. The thing I do to deal with this problem is to look at valuations. As a value investor, I believe the price you pay determines the return of a financial asset. This implies an investor can pay too much, even for the most defensive stock. My method to find crash proof shares is fairly straightforward. In this spreadsheet you find the names of the shares of the S&P and Stoxx companies, its sector and return during the credit crisis (source: Bloomberg). Moreover, I added the P/E-ratio in 2007 (pre-crisis) and the current P/E of every share. In my quest for resilient stocks I look for shares in defensive sectors that have P/E-ratios that are similar, preferably lower, than before the crisis. In the last step an investor should investigate if there is a reason for the low valuation. The investors should for instance examine if the nature of the business have changed permanently in the past 6 years due to divestitures or acquisitions. Investors should also try to assess whether the markets for its end products have structurally changed due to disruptive entry of new competitors (although I believe one can find value in oil today, some investors believe this could be the case with oil stocks). I additionally cannot stress enough the importance of a strong balance sheet. In the aftermath of the credit crisis, I have seen billions of shareholder value getting destroyed by overleveraged companies that faced a decline in cash flows and had to raise capital at very unattractive terms for existing shareholders to survive. Wal-Mart as an example It is beyond the scope of this article to examine individual stocks in great detail. For now I only want to have a close look at the best performing sector in the U.S. during the credit crisis: consumer staples. The best performing stock in this sector is retail giant Wal-mart. To me it is absolutely amazing this stock gained 7 percent in the worst investment climate ever. In this long read article, I extensively argue that Wal-Mart is an attractive investment at the current valuation. After my analysis of today, I decided to increase my position in the company. I not only expect attractive long run returns of Wal-mart, I also expect the stock will be resilient in an unfortunate scenario where markets start turning against us. Thanks for reading, and I hope you find some great stocks yourself by scrolling down the list — please let me know which. Editor’s Note: This article discusses one or more securities that do not trade on a major U.S. exchange. Please be aware of the risks associated with these stocks. Disclosure: I am/we are long WMT. (More…) I wrote this article myself, and it expresses my own opinions. I am not receiving compensation for it (other than from Seeking Alpha). I have no business relationship with any company whose stock is mentioned in this article.

Tough Times Ahead For REC Silicon ASA

REC Silicon posted yet another abysmal quarter with no respite in sight. As predicted, the company’s inventory build plan backfired, and the company raised capital through debt and equity offerings in the last 24 hours. We believe the management is too optimistic, and as such do not see much joy for shareholders for quite some time to come. REC Silicon ( OTCPK:RNWEF ), as we forecasted , reported horrendous second quarter results on Tuesday. While revenues of $93M is an improvement over $74.4M from Q1, they come at a steep cost to the company in terms of plummeting ASPs. As a result of the plummeting ASPs, EBITDA declined again from $24.8M in Q1 to $5.8 million in Q2. The process-in-trade loophole, through which the company has been shipping polysilicon to China in the recent past is no longer available to the company, and effectively a big part of the company’s customers disappeared overnight. Against this backdrop, the company built another 1248 MT of inventory as it was unable to sell its poly production in the market. This inventory build in a downward pricing environment sapped the company’s cash flow, and the company has now come to the realization that its current business vector is not sustainable. However, as we wrote earlier, this handwriting was on the wall when the company decided to build inventories instead of selling product due to low ASPs in Q1. In the face of further declining prices and balance sheet stress, the company opted to sell product at distressed prices. While the FBR poly produced by REC Silicon has typically commanded lower ASPs than Siemens poly that most of the industry produces, the gap between the prices has increased dramatically in the recent quarters. This gap opened up further at the end of Q2 (see chart below). We believe there are two reasons for this widening gap. The first is that instead of withholding selling at the low prices as the company did in Q1, the company sold product at artificially low price to raise some much-needed cash. Secondly, customers sensing the upcoming changes to Process-in-Trade, and the company’s financial position, appear to have negotiated hard and gotten steeper discounts than usual. While the company sold a significant amount of polysilicon at low prices in the quarter, the production continued to be ahead of sales. The resulting 1248 MT inventory build in the quarter has now increased the company’s inventory to approximately 6000 MT – approximately 4 months of sales. Finally, the company decided that it cannot keep building inventory and has decided to cut its production at its Moses Lake facility. This reduced the company’s manufacturing capacity by about 2000 MT. The company also decided to put on hold its expansion plans. REC Silicon had previously planned 3000 MT of new capacity using its updated FBR-B process. This new process could have helped the company further improve cost structure but is now being halted with an eye towards a future restart. The company is conducting an orderly shutdown process and expects to be able to bring the facility to production within a year once it decides to restart the work. With these production moves, the company is dramatically reducing its capacity and expects that it will deplete its current inventory by 1500 MT in Q3. This would help generate some much needed cash flow for the company. The company also made an equity offering last night and sold about 10% of the company shares. REC Silicon allocated 230,000,000 new ordinary shares at a price of NOK 1.55 per share in the Private Placement to existing shareholders and new investors, with gross proceeds of NOK 356.5 million (approx. $43M). The company also announced Thursday morning that it also has sold or agreed to sell a nominal value of NOK 155,000,000 (approx. $19M) of bonds held in treasury to investors to raise additional money. These moves dramatically strengthen the company’s balance sheet and reduce the fears of possible default of debt payments coming up in 2016. In the earnings call this morning , management commented that the adversity is temporary and caused by the tariff war between US and China, and that the company expected the trade situation to be resolved by early 2016. Over the short term, the company sees Korean manufacturers supplying 60% of China import needs, German manufacturers supplying 30% of the needs, and the US poly manufacturers essentially shut out of the market. With the tariffs, the company expects that Korea production will mostly go to China leaving the US producers to chase Malaysia, Taiwan and other countries. REC management contends that the current low polysilicon prices are due to tariffs and Chinese government subsidies will not prevail in the long term. The company’s worst case plan involves shipping product to countries outside of China and continuing with interim measures such as tolling until the Company’s Yulin JV enters production, at which time, the company expects to be able to serve the China market. REC sees polysilicon becoming the choke point in PV production and expects poly prices to recover. The company, with over a billion dollars in assets, is not taking any impairment charges in spite of these developments because it expects the trade situation to be resolved by the beginning of 2016. We see the management’s view, even the most pessimistic version, as likely too optimistic. We do not see any indication that the tariffs are likely to go away quickly and we do not see an end to production from China’s SOEs and other heavily subsidized Chinese manufacturers. We also do not buy the commentary that a long-term shortage of poly will develop and that the poly prices will move up meaningfully. Even a more moderate set of assumptions would suggest that the company’s thesis that the current market economics will not work and the prices will go up over time is highly speculative. Unfortunately for the company, the reduction of production means the fixed cost absorption will be a problem and the company will have an inferior cost structure going forward. The company’s manufacturing roadmap, which relied on the lower cost FBR-B production, is now problematic. Because of these factors, we believe it is highly likely that the company’s assets are severely impaired. The company’s silicon gas sales, which do not depend on the polysilicon business, provide a respite to the company. However, this product line offers no significant long-term growth benefit to the company’s story. While the management presents itself as planning for worst case, we believe the company is far too optimistic. Given the tariff uncertainty, likely low polysilicon prices, impending new capacity, and commodity nature of the industry, investors in the company may not have much to celebrate for a long time to come. Our view on RNWEF: Avoid. Editor’s Note: This article covers one or more stocks trading at less than $1 per share and/or with less than a $100 million market cap. Please be aware of the risks associated with these stocks. Disclosure: I/we have no positions in any stocks mentioned, and no plans to initiate any positions within the next 72 hours. (More…) I wrote this article myself, and it expresses my own opinions. I am not receiving compensation for it (other than from Seeking Alpha). I have no business relationship with any company whose stock is mentioned in this article.