Tag Archives: undefined

Freeport-McMoRan: A Lesson In Listening To The Model

Summary After I designed a model that was surprisingly effective at predicting movements in Freeport-McMoRan, I stopped listening to it. The model was clearly predicting the latest crashes in Freeport-McMoRan. As bad as things are for Freeport-McMoRan, the commodities suggest current pricing is pretty fair. Freeport-McMoRan (NYSE: FCX ) has been in freefall for the last month or so. There have been great opportunities to get out, but I missed them because I was focused on doing analysis on other parts of the market. This is a story of the massive mistake I made and how easily it could have been prevented. Predicting Commodity Prices From the start, I’ve said that my goal is not to predict commodity prices because predicting which way the prices will move is not within my skill set. When I make investing decisions, I want to be functioning within my area of expertise. When it comes to Freeport-McMoRan my area of expertise was building a model that was vastly better at predicting returns than I could be relying on any other tool. Despite knowing that my area of expertise was in building the model, I allowed myself to be swamped with work and didn’t return to regularly run my model the way I did during my first stint investing in Freeport-McMoRan. How I Should Have Done It The best method for me would have been to write it into my schedule that at least every week I had to completely rerun my model and decide if the stock was worthy of investment at that point given the results. Unfortunately, I didn’t do that. I ran the model around June 7th, decided it was getting risky and posted my downgrade and intent to keep running the model and watching for strong indicators to get out. The proper choice, clearly, would have been to sell out immediately rather than looking to get a tiny bit of extra return relative to my index by holding the position. Let this be a lesson to all investors to keep a close eye on those volatile investments. At the same time, it would have been wise for me to make some improvements to make the model easier to update. That may have encouraged me to keep checking it every day rather than allowing my early summer days to become swamped with other activities. I’ve taken both of those lessons to heart. The saddest irony, as you’ll see, is that the spread widened further, precisely as I predicted over the next couple weeks. Part of that time was when I was out of the state and away from my model. Clearly, I should have closed out the position before I left. Getting Up to Date I reran my model which uses the opening values for shares of Freeport-McMoRan along with the opening values for different ETFs that track 4 of the 5 commodities Freeport-McMoRan produces. I use those ETFs to track the estimated price change in futures contracts on the commodities as a way of seeing where commodity prices are going. Occasionally Freeport-McMoRan will move before the futures prices on the commodities but a large divergence has been a clear sign that a correction is coming. In using those commodities I built my model to predict average annual EBITDA for FCX over the next couple of years and then set a standard deduction from that value to estimate the other necessary cost implications because interest, depreciation and amortization are very real costs. Taxes is also a real cost, but will generally scale in such a way that it is automatically accounted for in my model. That should sound very complex to readers that didn’t see my previous work on Freeport-McMoRan, but the charts are easy enough to read. The chart below shows the values for EBITDA minus the static. As you can see, the lines show a very strong connection. (click to enlarge) While I like that method for looking at the correlation over the long term, I prefer to actually read the output using bar charts. The following chart shows the values for the last seven months: (click to enlarge) I designed these charts using the opening values for each ticker. We don’t have the opening value for Monday, so I inserted the closing prices for Friday, July 24th as “July 25th”. As you can see, over the last couple months the shares have fallen significantly but not by near as much as the expected earnings. Contrary to popular belief, Freeport-McMoRan stock was actually holding up well if we compare it to the fundamental earning power of the company. You may notice the left side of the chart is done in percentage terms. I standardized all the values in that chart based off the values from the start of 2014. There is no reason to think that the values from the start of 2014 were perfectly aligned, but it made it possible to reliably get both bars onto the same scale to compare relative strength. Relative Strength I put together another chart that makes it even easier to read. This chart standardizes based off percentage change from the values on May 20th. (click to enlarge) Had I been disciplined enough to force myself to update the spreadsheet more regularly, I would have been out without a problem. I’m providing an even larger version of the very clear “Get the **** out” signal: By the middle of June the model was sending off extremely strong sell signals. When I tried to do an eyeball test of the movement by simply looking at price charts in early July, I thought the commodities were moving before Freeport-McMoRan and started to doubt my model. If I had updated it completely, I would have seen that Freeport-McMoRan was simply catching up with the losses the model was predicting and I would’ve got the heck out. What Does It All Mean for Freeport-McMoRan? Based on my model, the closing values put us fairly close to fairly priced. That makes decisions to buy or sell fairly neutral. The biggest concern on buying is that the volatility is enormous. I’ll be putting in some work to make the model easier for me to update and then I’ll be watching for another one of those clear buying or selling signals. At the moment the model is quite neutral since the red line is only mildly taller than the blue. This wasn’t a case of my model failing me, it was me failing the model and paying dearly for it. I designed my system around having an index of ETFs that I could use as my benchmark. This is the same batch of ETFs that I use in estimating EBITDA based off commodity futures contracts. Relative to the benchmark, I’m “winning”. The benchmark is down 52.4% and FCX is down 48.4%. Somehow, this doesn’t feel like winning. Disclosure: I am/we are long FCX. (More…) I wrote this article myself, and it expresses my own opinions. I am not receiving compensation for it (other than from Seeking Alpha). I have no business relationship with any company whose stock is mentioned in this article. Additional disclosure: Information in this article represents the opinion of the analyst. All statements are represented as opinions, rather than facts, and should not be construed as advice to buy or sell a security. Ratings of “outperform” and “underperform” reflect the analyst’s estimation of a divergence between the market value for a security and the price that would be appropriate given the potential for risks and returns relative to other securities. The analyst does not know your particular objectives for returns or constraints upon investing. All investors are encouraged to do their own research before making any investment decision. Information is regularly obtained from Yahoo Finance, Google Finance, and SEC Database. If Yahoo, Google, or the SEC database contained faulty or old information it could be incorporated into my analysis.
Finding Value In The Fed Rate Hike

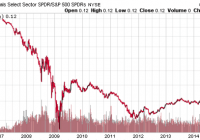
Summary Value funds have under performed post-2008 in part due to weakness in the financial sector. Rising interest rates are a sign of a strong economy and financial companies are more profitable with higher rates. Value is at its cheapest relative to growth in many years. Value has been in the doldrums for years due to underperformance in the financial sector. Financials led the market lower in 2007 and 2008. Following the rebound, banks were targeted by regulators and litigation costs weighed heavily on the sector. To top it all off, the Federal Reserve’s decision to keep interest rates at zero put a lid on the profitability from lending, at a time when borrowers were harder to find. The result was a long period of underperformance from the financial sector. Over the past 8 years, a good performance from the sector has generally been match the broader market’s gains, as the price ratio of the Financial Select Sector SPDR ETF (NYSEARCA: XLF ) versus the SPDR S&P 500 Trust ETF (NYSEARCA: SPY ) shows: (click to enlarge) With the Fed poised to hike rates, the financial sector is starting to come back to life. On July 20, St. Louis Federal President James Bullard said an interest rate hike in September was a 50-50 possibility. Even if a rate hike doesn’t come in September, a hike at the October or December meeting is coming (assuming economic data doesn’t take a sudden turn for the worse). The resulting increase in interest rate spreads, along with a stronger economy, should generate greater profits and improved overall balance sheets for banks and other financial services companies. Another reason to like the financial sector here, especially if you’re long-term bullish on the economy, is that banks currently have their dividend yields suppressed by regulators. Before the financial crisis, many banks paid out 50 percent or more of earnings as dividends. Today, banks are limited to 30 percent. Even if nothing changes to bank profitability, many banks could hike their dividends by as much as two-thirds based on today’s earnings if regulators ease up, which is likely as the memory of 2008 fades. Investing For the Shift Obviously, one way to play a rebound in the financial sector is directly with financial sector funds, but another set of funds that will be impacted by a rebound in financials is value funds because many value funds are overweight the financial sector. One fund that has hefty exposure is the Vanguard U.S. Value Fund (MUTF: VUVLX ), at 30.3 percent in the sector as of June 30. It has been a tough few years for VUVLX and other value funds due to its largest sector weighting delivering middling performance. Value funds also tend to be overweight energy and it’s been a terrible sector in the past year. Value has underperformed growth due to the recent spike in technology companies. Strong earnings from Internet firms such as Google (NASDAQ: GOOG ) and Netflix (NASDAQ: NFLX ) have pushed growth shares sharply higher. As this chart comparing the price of VUVLX to the Vanguard U.S. Growth Portfolio (MUTF: VWUSX ) show s, the recent drop in energy combined with the spike in growth shares has really weighed on relative returns. Once the financial sector starts outperforming, this performance will change for the better. (click to enlarge) VUVLX The four-star Morningstar rated Vanguard US Value Fund Investor Class seeks long-term capital appreciation and income by investing the majority of its assets in shares of U.S. common stock. The fund has a focus on large- and mid-cap value stocks that management perceives to be out of favor with the general market. These stocks may also have higher-than-average dividend yields and lower-than-average price/earnings ratios. As of the end of June 2015, VUVLX has a significant exposure to financial services stocks. Investment Strategy Portfolio managers James Troyer, James Stellar and Michael Roach are at the helm of VUVLX. The management team uses proprietary software and a quantitative-driven investment approach to identify stocks that they believe offer a good balance between strong growth and reasonable valuations when compared to industry peers. Managers construct the portfolio from stocks selected primarily from the Russell 3000 Value Index. While the fund typically concentrates on large- and mid-cap companies that the managers believe are selling below their true worth, it has no restrictions on the size of the companies in which it may invest. The fund may also invest up to 20 percent of assets in foreign securities and engage in currency hedging strategies associated with those investments. Fund managers are authorized to invest 15 percent of assets in restricted securities or other illiquid investments as well as hold small positions in stock futures, derivatives and exchange-traded funds. The fund may also take defensive positions, such as holding a large cash position, on a temporary basis in response to unusual market, economic or political conditions. The fund’s goal is to outperform the underlying benchmark Russell 3000 Value Index. This investment strategy has enabled VUVLX to beat the Large Value Category averages since its inception in June 2000. Portfolio Composition and Holdings VUVLX currently has $1.3 billion under management. The portfolio holds 99.28 percent of assets in U.S. stocks with the remainder in cash. The fund has a 37.24 percent exposure to Giant Cap stocks as well as 29.44 percent and 19.20 percent exposures to large- and medium-cap stocks. VUVLX also holds 12.08 percent and 2.05 percent of assets in small- and micro-cap stocks. The portfolio is heavily weighted toward the Financial Services, Healthcare and Industrial sectors. VUVLX is underweight Consumer Defensive and Energy shares. The fund has a P/E ratio of 15.67 and a price-to-book of 1.83. This broadly diversified fund normally invests in approximately 200 individual holdings across all market categories. The portfolio currently holds 238 individual securities with an average market cap of $32 billion, which compares to the category average of just over $84 billion. The top 10 holdings comprise 21.3 percent of holdings. They include Exxon Mobile (NYSE: XOM ), Wells Fargo (NYSE: WFC ), JPMorgan Chase (NYSE: JPM ), Johnson & Johnson (NYSE: JNJ ) and General Electric (NYSE: GE ). The next five largest holdings are Berkshire Hathaway (NYSE: BRK.A ), Proctor & Gamble (NYSE: PG ), AT&T (NYSE: T ), Pfizer (NYSE: PFE ) and Schlumberger (NYSE: SLB ). Historical Performance and Risk The fund has consistently beat its category. VUVLX generated 1-, 3- and 5-year total return averages of 6.82 percent, 19.64 percent and 17.86 percent respectively. These compare to the category averages over the same periods of 3.92 percent, 16.27 percent and 14.49 percent. VUVLX has an Above Average 3-year Morningstar Return rating and an Average 3-year Risk Rating. The fund has a 0.98 beta and a standard deviation of 8.93. These compare to the category averages of 0.98 and 8.55. VUVLX has a 30-Day SEC Yield of 1.99 percent. Expenses, Fees and Distribution This open-ended fund has an expense ratio of 0.29 percent, which is significantly less than the category average of 1.19 percent. VUVLX does not have any initial, deferred, redemption or 12b-1 fees. The fund has a $3,000 minimum initial investment for taxable and qualified non-taxable accounts. Conclusion Investors aren’t very interested in value today and as a result, value is the cheaper than it has been in years relative to growth. Growth stocks are enjoying a great run this year and thanks to solid earnings reports in July, another growth spurt is underway. Amazon (NASDAQ: AMZN ) reported strong earnings on Thursday and shares popped in after-hours trading, extending growth’s 2015 run. Investors too often chase what’s hot at the moment though, and with a major change in interest policy looming, a reassessment of long-term positioning is warranted. Putting aside the fundamental case for a turnaround in value, on a relative basis it appears value is due for a rebound. Add in the case for a stronger financial sector, which itself has spent most of the past 8 years underperforming or matching the performance of the broader market, and there’s a strong case to be made for value staging a comeback in the years ahead. Disclosure: I am/we are long VUVLX. (More…) I wrote this article myself, and it expresses my own opinions. I am not receiving compensation for it (other than from Seeking Alpha). I have no business relationship with any company whose stock is mentioned in this article.

Apple Teaches Another Lesson In ETF Weighting

Summary Apple’s stock price fell in response to disappointing numbers. Due to its large market capitalization, the company’s moves will affect sector ETFs, notably those that track the tech industry. Alternatively, investors can use ETFs that track equal-weight methodologies to diminish the effect AAPL has on a tech sector investment. By Todd Shriber & Tom Lydon Shares of Apple (NASDAQ: AAPL ) fell 4.3% Wednesday, and at one point during the session, the iPhone maker was lighter by $60 billion in market value, after the company “disappointed” Wall Street by reporting that fiscal third-quarter profit rose “slightly” to $10.7 billion from $7.74 billion on revenue of “just” $49.61 billion. Apple’s Wednesday woes are, predictably, having a dour effect on the exchange traded funds that feature heavy allocations to the iPad maker. For example, the Technology Select Sector SPDR ETF (NYSEARCA: XLK ), the largest technology ETF by assets, has an almost 18% weight to Apple, enough to have the fund trading lower by 1.5% today. XLK’s Wednesday decline, and those of rival technology ETFs with significant Apple weights, reminds investors of the potential dangers of owning a fund with large weights to just one or two stocks. “Apple is a top-10 holding in 98 equity ETFs according to S&P Capital IQ. Besides being the largest stock, ETFs tied to the S&P 500 index like Vanguard S&P 500 ETF (NYSEARCA: VOO ) and the Russell 1000 like the iShares Russell 1000 ETF (NYSEARCA: IWB ), the technology giant is more heavily weighted in popular tech-laden products,” according to S&P Capital IQ. The PowerShares QQQ Trust ETF (NASDAQ: QQQ ), the NASDAQ-100 (NDQ) tracking ETF, entered Wednesday with a roughly 14% weight to Apple, enough to send that ETF lower by more than 1%. The $2.9 billion iShares U.S. Technology ETF (NYSEARCA: IYW ) is perhaps the epitome of an “Apple ETF” with a 20.9% weight (as of July 21) to the stock. That big Apple weight was enough to drag IYW lower by almost 2% yesterday. As S&P Capital IQ notes, there are ways to maintain tech sector exposure via ETFs while mitigating Apple or any other single stock risk. The First Trust NASDAQ-100 Equal Weight Index ETF (NASDAQ: QQEW ) and the Direxion NASDAQ-100 Equal Weighted Index Shares ETF (NYSEARCA: QQQE ) are equal-weight alternatives to QQQ. No stock accounts for more than 1.2% of QQEW’s weight and QQQE had 1% weight to its constituents at the end of the second quarter, according to issuer data . Those ETFs lost about a third of a percent yesterday. The rub is that when Apple performs well, QQQE and QQEW will lag QQQ. Even with Wednesday’s slide, Apple is up more than 13% this year, helping QQQ to a 9% gain, better than double the returns of QQQE and QQEW. The $954.2 million Guggenheim S&P Equal Weight Technology ETF (NYSEARCA: RYT ) has a weight of less than 1.6% to Apple. That is less than the ETF’s weight to Facebook (NASDAQ: FB ), eBay (NASDAQ: EBAY ) and Visa (NYSE: V ). S&P Capital IQ has market weight ratings on QTEW and RYT. Direxion NASDAQ-100 Equal Weighted Index Shares ETF (click to enlarge) Tom Lydon’s clients own shares of Apple, Facebook and QQQ. Disclosure: I am/we are long QQQ, AAPL, FB. (More…) I wrote this article myself, and it expresses my own opinions. I am not receiving compensation for it. I have no business relationship with any company whose stock is mentioned in this article.