Tag Archives: undefined

DXGE: The Euro Advantage

DXGE is a relatively new fund with solid returns since its inception. DXGE is weighted towards cyclicals in the best performing EU economy. The fund utilizes a U.S. Dollar hedge to protect against Euro volatility. There are several good ways to invest in Europe through individual country ETFs or by NYSE-ARCA listed European companies. One recent listing is the WisdomTree’s Germany Hedged Equity ETF (NASDAQ: DXGE ) . The German economy is, by far, the best performing industrial EU economy. The Euro has been weakened by extraordinary quantitative easing and by the continuing Greek debt impasse. A weak Euro benefits the German export economy greatly; however, currency volatility can work against an economy, too. Even hedging a portfolio will not eliminate currency risks entirely, but properly managed it will dampen volatility. In particular, it might ‘buy a little time’ for the investor to react should currency volatility suddenly work against a portfolio. According to WisdomTree: The Index and the Fund are designed to provide exposure to equity securities in Germany, while at the same time hedging exposure to fluctuations between the value of the U.S. dollar and the Euro . Germany has a $3.6 trillion dollar economy, 6th largest by World Bank GDP purchasing power parity calculations, with 2015 estimated 1.8% annualized growth and 15th per capita PPP-GDP at $44,469.00. According to the Deutsche Bundesbank Monthly Report , the economy grew 0.3% in the first quarter, down from the previous quarter’s reading of 0.7% but rebounded in the second quarter: … The German economy has recovered more quickly than expected from the cyclical lull in the middle of last year… …Bundesbank economists write that the economy has returned to a growth path underpinned by domestic and foreign demand… …Although foreign trade is currently being hampered by dampening global dynamics, it is simultaneously being buoyed by the euro’s depreciation and the strengthening economic recovery in the euro area. …In this setting, Bundesbank economists estimate that growth of 1.7% in Germany’s real gross domestic product (GDP) this year could be followed by a rise of 1.8% in 2016 and 1.5% in 2017. In calendar-adjusted terms, this would be equivalent to expansion rates of 1.5% in 2015 and 1.7% in both 2016 and 2017… In other words, in spite of all the issues in Europe and Asia, the German economy is still expected to grow. (click to enlarge) The top ten holdings should give the investor a good grasp of Germany’s global corporate dynamic. Of the fund’s top ten holdings 15.959% are automotive companies . The largest holding is Daimler AG ( OTCPK:DDAIY ) at 6.4195%; Daimler has 279,972 employees in production facilities in Europe, North and South America, Asia and Africa. Bayerische Motoren Werke ( OTCPK:BAMXY ) follows at 5.47505% of the top holdings; BMW employs over 100,000 in 14 countries. Lastly is Volkswagen ( OTCQX:VLKAY ), at 4.06418% of the top weighted companies, with 592,586 employees in 31 countries. (Data from WisdomTree) Financials comprise two of the top ten holdings accounting for 18.825%. Allianz ( OTCQX:AZSEY ) is a global financial services company, employing 147,000 in over 70 countries; accounting for 5.96224% of the fund. Muenchener Rueckversicherungs ( OTCPK:MURGY ), at 4.06405%, promotes itself as a global ‘one stop’ primary and re-insurer with 43,000 employs world-wide. Industrials have two companies in the top ten holdings. BASF ( OTCPK:BFFAF ), at 5.11571%, is a diversified manufacturer of both industrial and consumer products with 112,000 employees globally. Siemens ( SIE ), 5.10539%, manufactures industrial equipment, provides financial solutions for industrial customers and also has a consumer products division. Siemens employs over 343,000 in 300 countries. Industrials account for 19.191% of the top ten holdings. There’s an important point to be made here. Since a large portion of manufacturing and services are located outside of Germany, it’s reasonable to assume that if cost reductions are necessary they will be spread out globally. Thus work force reductions, if needed, can be widely distributed, minimizing the impact on local economies. The most telling statistics are the weightings which favor an expanding economy. Cyclicals such as Consumer Discretionary, Financials and Materials, account for a combined 51.42%. Cyclically sensitive sectors such as Telecom Services, IT, and Industrials, account for a combined 28.31%. Lastly, defensive holdings such as Consumer Staples, Utilities and Health Care, account for a combined 20.27%. In total, over 75% of the most heavily weighted holdings are cyclicals or semi-cyclical. Germany’s largest exports are: Autos at 11.22% of all exports; Vehicle Parts, 4.12%; Medicaments, 3.64% and Aerospace, 2.44%. It should also be noted that Engine Parts are 7th at 1.09%; Delivery Trucks, 12th at 0.90% and Transmissions, 13th at 0.87% of all exports. This is indicative of final auto assembly completed outside of Germany. Among the top export partners are: France at 8.81%; United States, 8.14%; China, 6.35%; United Kingdom, 6.21% and Netherlands, 5.84%. (click to enlarge) (Data from OEC) Of those top ten export destination, two present a serious problem. First is the continuing conflict in Ukraine, for which Germany is the leading moderator for a resolution. Russia’s top imports from Germany are automobiles, vehicle parts and machinery. Next is China which has been experiencing slowing growth. China imports automobiles, vehicle parts, aerospace products and machinery. Combined, Russia and China account for 18% of German industrial exports. (click to enlarge) The German export economy has an advantage by the weak Euro. Hence, German companies should reflect quarter over quarter earnings growth which in turn should reflect in equity market gains. Also job and wage growth, consumer spending and other domestic metrics should fare better than the EU as a whole in an uneven global economic environment. (click to enlarge) The fund holds $405,900,000 of assets in 78 equity holdings, as well as a short-long currency forward contract hedge. The ETF itself has 13,550,000 shares outstanding with a recent market price of 29.52 and a Net Asset Value of $29.96, thus trading at a discount to the NAV of about 1.49%. The average daily trading volume is approximately 140,487 shares. There are two competing currency hedged funds; three have nearly equal positive one year returns, one of which is the WisdomTree Fund. Three others have negative year returns. The table below compares the annualized returns of the Deutsche X-trackers MSCI Germany Hedged Equity ETF (NYSEARCA: DBGR ) and the iShares Currency Hedged MSCI Germany ETF (NYSEARCA: HEWG ). Note that WisdomTree uses its own underlying Germany Hedged Equity Index , while the X-Tracker and iShares utilize the MSCI Germany Hedged Index Fund (Mkt) 1 Month 3 Months Year to Date 1 Year 3 Year WisdomTree DXGE -3.55% -7.67% 15.86% 9.81% Incepted 10/17/13 X-Trackers DBGR -3.74% -8.21% 12.19% 10.36% 12.40% iShares HEWG -4.22% -8.58% 10.88 9.89 Incepted 1/31/14 In conclusion, this is a well-constructed single country focused fund, hedged against Euro weakness, with particularly good potential while the weak Euro gives its exports a price advantage. Disclosure: I/we have no positions in any stocks mentioned, and no plans to initiate any positions within the next 72 hours. (More…) I wrote this article myself, and it expresses my own opinions. I am not receiving compensation for it (other than from Seeking Alpha). I have no business relationship with any company whose stock is mentioned in this article. Additional disclosure: CFDs, spreadbetting and FX can result in losses exceeding your initial deposit. They are not suitable for everyone, so please ensure you understand the risks. Seek independent financial advice if necessary. Nothing in this article should be considered a personal recommendation. It does not account for your personal circumstances or appetite for risk.
Profiting From Market-Derived Forecasts Of The VIX Index

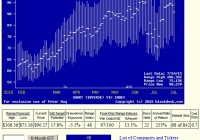
Summary The VIX Index is a measure of the recent past, not a forecaster of the near future. Its ongoing price behavior can be interpreted by behavioral analysis to imply probable near term ranges of future price activity limits. Those forecast ranges occasionally offer odds-on, high-return, profit potentials by use of ETFs, leveraged or otherwise. Market timing? Can it actually be done? You bet – it has been, frequently, with significant payoffs. Take a look at the experiences with the ProShares Short VIX Short-Term Futures ETF. A Quick Review of the VIX and the Market The VIX index measures the recent past amount of uncertainty in the principal stock market index, the S&P 500 (SPX). The measurement is implied by prices being paid by investor/speculators in options on the SPX, through a well-known analysis process called “implied volatility.” When stock prices rise, implied vols (and the VIX index) go down; when stock prices go down, the VIX rises. For a more complete perspective, see the SA article “Dog days of Summer”. This inverse relationship of VIX prices to stock index prices complicates thinking about profiting from the VIX. What is needed for comfortable thinking is a vehicle that offers a price action that is inverse to the VIX Index. For the individual investor, one that is advantageous in many dimensions is the ProShares Short VIX Short-Term Futures ETF (NYSEARCA: SVXY ). The SVXY has been in existence since fourth quarter 2011, for some 3+ years, and options have been trading on it starting about six months later. As a full-fledged ETF it has pricing veracity that is market-verified and supported, without the sponsor-creditworthiness value overlay questions of an ETN. An alternative to SVXY is the VelocityShares Daily Inverse VIX Short-Term ETN (NASDAQ: XIV ), which has a slightly longer history, but no options trading. The lack of options prevents its price range forecast capability, which will become an apparent critical limitation. Behavioral Analysis Forecasts of SVXY Price Range Prospects Regular readers of our articles understand that we can translate into coming price range expectations of securities the hedging done by market-makers [MMs]. That hedging is a form of price protection for firm capital put at risk as they provide market liquidity to temporarily fill the imbalances caused by volume transaction orders of big-$ fund portfolio manager clients. Here is how the recent trend of those derived expectations has compared with the market quotes of SVXY at the time of their forecasts. Figure 1 (click to enlarge) (used with permission) The vertical lines in the picture are not past actual market prices experienced by the subject, but are expectations of the range of prices that could be experienced in coming weeks and months. Those expectations are implied by the prices demanded by sellers of hedges, willingly paid by MM buyers of price protection hedges, and considered as acceptable market liquidity supporting costs by their clients, real-money transaction initiators. The heavy dot in each day’s line is the closing price of the subject at the time of the forecast, and divides the expectations into upside and downside prospects. Those proportions are measured daily by the Range Index, which tells what percentage of the whole range lies below the current market quote. The small thumbnail picture at the bottom of Figure 1 shows the distribution of those Range Indexes over the 842 day life of this ETF. Many things can influence the expectations for coming prices of this underlier, but it turns out that historically the size of the Range Index has had pertinent implications for its subsequent actual market quotes. A daily maintained actuarial record supports the displayed row of data between these pictures. Using the Range Index of the day for SVXY of 48, a quick visual check of the most recent forecast vertical range at the right of the picture confirms that the market quote then of $90.27 was about in the middle of the forecast range of from 75.16 to 106.36. In the ETF’s life of 842 market days there had been 68 days with a similar Range Index. Taking all 68 of those experiences, 66 had prices either reach the top of their forecast range within 3 months, or by the end of that time a closeout of the position called for by the holding period limit of 3 months would be at a profit, compared to SVXY’s closing price position cost the day after the forecast. The other 2 would produce losses. Combining winners and losers created an average payoff per position of +13.1%. But because many of the 64 reached their targets quickly, while the losers both had to be held a full 63 market days, the average holding period for all 68 was only 25 market days. In a year of 252 market days that +13.1% net gain, compounded ten times amounts to an annual rate of +253%. Is active investment management, profit compounding, real? To provide live confirmations of what can be done with Market-Maker forecasts and robust exercise of the T ime- E fficient R isk- M anagement D iscipline [TERMD], starting at the beginning of 2015 we began issuing to subscribers daily lists of our top 20 ranked stocks and ETFs. The ranking schema valued a tradeoff between MM upside price forecasts and prior experience of worst-case price drawdowns experienced during TERMD holding periods subsequent to forecasts similar to the day’s. Careful actuarial records of complete experiences, issue by issue, day by day, since the start of this century support the data shown in Figure 1. Figure 2 spells out the specifics of the 6 instances of SVXY recommendations made in real time, as seen by some of our subscribers on lists from the days indicated. Figure 2 (click to enlarge) As can be seen, the six completed buy positions all produced double-digit gains (column 19) in holding periods ranging from 9 calendar days to 53, producing triple-digit rates of gain, and 79% of profit in less than 6 months. It should also be noted that on each day SVXY competed with over 2500 other equity investment candidates to be on the top 20 lists. In its most successful six days (out of over 140) there were 19 other able competitors, and in the other days, 20 more able. The competition is a function of columns (5), (6), and (8), conditioned by (13) and (12). Column (15) is a composite measure weighting (5) by (8) and (6) by 100-(8) to make an odds-weighted reward vs. risk tradeoff based on the actual prior experiences of forecasts like today’s (7) as counted in (12) out of those available in the past five years (12). These elements are all identical factors in any of the 2500+ competing candidates, making it possible to directly evaluate their likely futures based on the way Mr. Market has subsequently treated the previous forecasts made by the MMs. This is no more of a technical analysis, because it is a comparison of price forecasts, than is any comparison of likely future price-earnings estimates made by fundamental analysts. The power of behavioral analysis In fact, the price forecasts of MMs include all the known fundamental analyst P/E estimates, their earnings and earnings growth estimates, appraisals of competitive trends, foreign currency translations, political influences, likely weather impacts, cultural trends in other geographic markets for the subjects’ products, and most importantly, the flow of volume stock transaction orders issuing from portfolio managers at MM big-$ investment funds that have the money muscle to move market prices. This is what behavioral analysis of investing is all about, where money meets the market, through people negotiating with one another, usually in informed, experienced combative contests of significant size. Academic musing over illusions and the mistakes humans at large may make may be entertaining, but it has proven to be years of fruitless effort in terms of developing any productive investment advantage. On the other hand, carefully-performed insightful analysis of day-by-day actions being taken by experienced, informed practitioners putting capital at risk and protecting against the risks they deem likely, tells a great deal about the investment subjects at hand in risk~reward terms and about the skills of the appraisers. Especially where they all are dealing in an environment that is competitively impossible to rig and is motivationally sound. Over 15 years of 252 market days and more than 2,500 equity security subjects each day have been collected from an unchanging evaluative model to provide an actuarial resource of multi-millions of price range forecasts and their actual market outcomes. Some, like SVXY, turn out to be enormously valuable, many others are so much GIGO. Knowing which is which should be helpful to individual investors who lack the MM’s extensive information-gathering resources of people, man-hours, and money. We take the posture of leveling the playing field for many investors who have often been treated unkindly, or in some cases not even fairly, by the investment establishment. Like several others who have reached the stage in their lives where they recognize it is time to give back to the civilization that has benefited them, we choose to do it by sharing our information with those who for whatever reason are behind schedule in their balance between wealth-building investment milestones and their financing objectives and needs. Over the years we have learned that free goods are rarely appreciated, often disdained, and in investing tend to lie unused. So we pose a trivial charge for our information to separate those who simply will grab anything the system gives them for free. Since the beginning of 2015 we have provided top20 ranked lists each market day, which now are being subscribed to by hundreds of individual investors, mostly repeatedly. The average annual rate of price gain from ALL 1760 completed positions under TERMD disciplines (74% profitably, 26% at a loss) has been +32%, compared to the parallel holding in SPY of +2%. Conclusion The current-day forecast for Friday will have its hypothetical position started with the end of day cost price for SVXY on Monday, following the standard TERMD score-keeping practice. It is entirely possible that any number of world events (including summertime boredom) may cause markets to continue to see price erosion that might cause SVXY prices to revisit the high-60s, low-70s seen in recent weeks. Should that happen, SVXY will likely become even more attractive and continue to compete effectively with other equity investment candidates. That argues for scaling into an SVXY position in measured bites rather than by one major commitment. But the present conditions have attraction that should not be ignored. For most individual investors the task of deciding on where to put capital at risk is a bewildering assignment. The choice by so many of turning such decisions over to others has often resulted in expected progress not yet being achieved, while many years of time that cannot be recovered has been expended. Having poor experience in relying on others, it is understandable to question just a different version of the same, particularly where terms like odds, payoffs, and drawdowns are involved that are not familiar. But for the investor in need, it quickly becomes apparent that time to devote to this second job (full-time if done thoroughly and adequately) is really beyond reach for most of us. A saving grace of the approach we advocate is that you are looking out, actively, for your own affairs, based on the extensive, but condensed, understanding of probable future prospects made by as genuine experts as can be found, in the process of looking out for their own best interests. Their appraisals of alternative choices are presented in sufficient detail of contrasting risk and reward dimensions to enable you to fit them into your own preferences. There is no guarantee that market outcomes of the past based on forecasts similar to ones being made currently will be repeated, but you have the choice of seeking historical precedents sufficient to your standards for the history to become a reassurance to you. It’s your investment capital at risk, you have the responsibility (and the privilege) of deciding how it should be applied. Where we can be of help we will do what we can. Disclosure: I/we have no positions in any stocks mentioned, and no plans to initiate any positions within the next 72 hours. (More…) I wrote this article myself, and it expresses my own opinions. I am not receiving compensation for it (other than from Seeking Alpha). I have no business relationship with any company whose stock is mentioned in this article.

JPN: A New Way To Invest In Japan

Summary Barron’s says it’s time to get long Japan. Deutsche Bank listed a new Japan ETF at the end of June. This new ETF may be an excellent way to buy Japan. On July 18th, Barron’s published an article titled, ” Time to Buy Japan’s Blue Chips .” Given that, and given that some investors may be seeking to gain exposure to Japan, I thought I would discuss and analyze one of the newest ways to get long Japan. The Deustche X-trackers Japan JPX-Nikkei 400 Equity ETF (NYSE: JPN ), freshly listed on June 24th, is Deutsche Bank’s newest Japan ETF, and the first U.S. listed ETF that tracks the JPX-Nikkei 400 Index. In this brief analysis, I will take a look at the underlying index that JPN tracks, how the fund is structured and how it compares to another Japan ETF. The Underlying Index To begin my analysis of JPN, I will first describe how the underlying JPX-Nikkei 400 Index works. This index is based on the 400 highest scoring (more on the “score” in a moment) listings from the JASDAQ and TSE. The scores are based on a four-part selection process, which begins with this screening: Listed for at least 3 years Must be common stock More assets than liabilities in the last 3 fiscal years No operating or overall deficit in the last 3 fiscal years Not designated to be de-listed After this initial screening, the top 1000 listings are selected based on market cap and trading value from the last 3 years. Those 1000 listings are then scored based on quantitative factors: 3-year average Return on Equity (40% weighting) 3-year cumulative operating profit (40%) Market capitalization (20%) Then, scoring based on qualitative factors is added where present: Appointment of independent outside directors Adoption of IFRS (International Financial Reporting Standards) Disclosure of English earnings information The top 400 listings are selected from the 1000 initially screened. I would also note that no single component makes up more than 1.5% of the index. Components JPN consists of 284 holdings. The fund is heavily weighted in industrials (20.28%), financials (18.96%), and consumer discretionary (17.08%). The top 10 holdings are as follows: KDDI Corporation ( OTCPK:KDDIY ) (Telecommunications – 1.83%) Nippon Telegraph and Telephone (NYSE: NTT ) (Telecommunications – 1.83%) Mitsubishi UFJ Financial Group (NYSE: MTU ) (Financials – 1.75%) Toyota Motor Corp (NYSE: TM ) (Consumer Goods – 1.62%) Mizuho Financial Group Inc (NYSE: MFG ) (Financials – 1.59%) FANUC LTD ( OTCPK:FANUY ) (Industrials – 1.55%) Japan Tobacco ( OTCPK:JAPAY ) (Consumer Goods – 1.54%) Mitsui Fudosan Company ( OTCPK:MTSFY ) (Financials [Real Estate] – 1.52%) SMC Corporation ( OTCPK:SMCAY ) (Industrials – 1.50%) Central Japan Railway Co. ( OTCPK:CJPRY ) (Services – 1.49%) Given that there is no major concentration in any one listing, I would say that this ETF is fairly well diversified. However, it is heavily weighted in the 3 aforementioned sectors, which make up a combined 56.32% of the portfolio. The other 43.5% of the portfolio comes from a combination of information technology, consumer staples, health care, telecommunication services, materials, utilities, energy, and “other.” The least represented sectors are utilities and energy, each at < 1%. Comparison to EWJ One of the most popular and liquid Japan ETFs is the iShares MSCI Japan ETF (NYSEARCA: EWJ ). EWJ provides "targeted access to 85% of the Japanese stock market" by tracking the MSCI Japan Index. MSCI's broad index composition methodology is based on market capitalization and liquidity. In this regard, EWJ's underlying is less selective than JPN's underlying. As a result, the MSCI Japan Index is currently up 14.36% YTD while the JPX Nikkei-400 Index is up about 17.50% YTD. EWJ has the same top 3 sector representations, although they are weighted differently. The most weighted sector in EWJ is consumer discretionary (22%), followed by financials (19.64%) and industrials (18.90%). EWJ is also arguably less diversified, with over 9% of the portfolio's value held in just two listings (Toyota Motor Corporation at 6.11% and Mitsubishi UFJ Financial Group at 3.05%). EWJ's expense ratio, at .47%, is marginally higher than JPN's, which is .40%. Just for reference, other Japan ETFs include: WisdomTree Japan Hedged Equity ETF ( DXJ) WisdomTree Japan SmallCap Dividend ETF ( DFJ) Deutsche X-trackers MSCI Japan Hedged Equity ETF ( DBJP) iShares Currency Hedged MSCI Japan ETF ( HEWJ) Conclusion My personal opinion is that JPN may offer better aimed exposure than EWJ because it tracks an underlying that adheres to a more strict selection process. However, a prospective investor should note that it is fairly illiquid right now, given that it is brand new. Furthermore, it should also be noted that there are other Japan ETFs that are currency hedged, which some may prefer depending on one's view of current macroeconomic conditions. While it is still early in the life of JPN, I think it is a fund worth further investigation if one of your goals is to be invested in quality Japanese equities. Disclosure: I/we have no positions in any stocks mentioned, and no plans to initiate any positions within the next 72 hours. (More...) I wrote this article myself, and it expresses my own opinions. I am not receiving compensation for it (other than from Seeking Alpha). I have no business relationship with any company whose stock is mentioned in this article. Additional disclosure: This article is not intended to be a recommendation to buy or sell Japanese equities. It is intended simply to break down a new product that may be useful to investors who have a long bias on the Japanese equity markets.