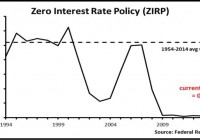
Summary Many responsible for portfolio construction forget the important role that cash plays in an overall investment portfolio. Cash plays several roles given divergences in the economic data and environment the investor is operating in, but I believe, some level of cash should be kept in all environments. Currently investors are earning close to 0% on cash, and alternative investments for cash are explored. Many investors have lamented at the lack of investment options for excess cash, and with good reason. Since the Fed began their extraordinary monetary policy which has included interest rates at the zero lower bound, savers have been deprived of a reasonable rate of interest on their cash savings. Most bank accounts currently pay 0.01%. This begs the question where should savers put their cash to earn a reasonable rate of return, while preserving the safety of principal? While there are few places to get the traditional 5% money market of the pre financial crisis era, there are several options for investors to park their cash to earn additional alpha. (click to enlarge) Reasons to Keep Cash The common theme on Wall Street is to have as little cash as possible. Today, many financial gurus are telling investors to keep 100% equity portfolios, as many expect the Fed to raise interest rates, and have instilled unnecessary fear into investors’ minds about bonds. As we will explore there are many reasons investors can, and should, keep cash on hand. Keeping Cash to Stay the Course As I discussed in my piece, the key to long term investment success keeping a certain percentage of ones assets in cash allows investors to stay the course in investing. As the financial crisis has shown many investors routinely say they can handle more risk than they can in a real life scenario. This disconnect between risk tolerance, the attitude towards risk, and risk capacity, the ability to actually withstand risk, is the reason that all too often an investor is their own worst enemy as they take money out of risk assets at the first hint of trouble. By keeping more safe assets on hand, investors can ride out the storms of the market and reach their long term investing goals. Keeping Cash to Take Advantage of Market Opportunities Market draw downs are not fun for the average investor. But as Bruce Berkowitz of Fairholme Capital says, market declines set up the environment for future outperformance. In addition to staying the course in the pursuit of achieving ones long term investment goals, having cash on hand, allows investors to take advantage of rock bottom prices on risk assets when the time is right. Yet another reason why the advice of the crowd, staying fully invested in equities, makes little sense. Keeping Dollar Bills in a Deflationary Environment In a deflationary environment, the value of the dollar increases in buying power. An investor keeping cash may be earning little return on their cash in the form of interest but is earning a great return in the real economy, as every dollar is worth more and more in buying power. As you can imagine this works the other way when we are talking about debt. In a deflationary environment, debt holders are strangled as every dollar owed increases in value. Keeping cash piles high and debt burdens low is imperative to profiting in a deflationary environment. An Overview of the Current Economic Environment In order to understand cash as an investment we have to first understand the current economic environment. This allows us to understand the role cash plays within the current context of portfolio construction. As I stated in The Key to Investment Success , holding cash and U.S. Treasury Securities, which are one in the same, is imperative to achieving ones long term investment objectives. However, the amount of cash held is subject to an analysis of the economic environment. Currently, the economic data continues to worsen it seems with virtually every data release from around the globe. Two weeks ago Singapore was expecting a positive increase to GDP of 0.8% instead GDP fell sharply at a rate of 4.6%. Just this past week we learned that South Korea has had its slowest GDP growth in six years. The challenges in China with slowing GDP growth and crashing stock markets are bringing even more uncertainty to the forefront. The debt crisis in Greece, and the continued over indebtedness of the Eurozone, and the United States continues to provide a drag on GDP that no one seems to be doing anything about. The data stateside is not bringing much confidence to the market place that our economy is capable of handling the eagerly anticipated rise in interest rates that the street has told us is coming as early as September. (click to enlarge) (click to enlarge) (click to enlarge) Velocity on M2 remains at a 50+ year low, u-6 unemployment remains elevated at 10.5%, the PCE, the Fed’s preferred measure of inflation, remains below the target of 2%, commodities are falling precipitously, and productivity in the U.S does not look good. We are nearly seven years into a recovery and yet the U.S continues to grow at an anemic 2.2% average. In my recent piece, Don’t Ignore The Weakness in Commodities , I argued that the slip in commodity prices is really indicative of a worldwide slowdown in economic growth, and rising deflationary forces. As both the public and private spheres are taking on more and more debt, there is simply less demand for goods and services. With this lack of demand and oversupply, we are seeing prices decline. In this type of economic environment holding sufficient levels of cash, and even being overweight cash and cash equivalents, such as U.S Treasury Bonds, is a prudent investment strategy in my opinion. Alternative Investment Strategies to Boost the Return on Cash There are many alternatives to boost the return on cash, but first we must remember that the objective of the cash sleeve of a portfolio is to provide stability and return OF our capital not to maximize return ON our capital. With that in mind here are three strategies to maximize the return on cash. Active Management Short Term Funds Some investors should consider the benefits of actively managed short term funds such as the PIMCO Enhanced Short Maturity Strategy ETF (NYSEARCA: MINT ). MINT is a fund that holds bonds with durations that generally do not exceed one year, with the objective of enhancing the return on capital to be greater than a money market fund. Currently MINT boasts a 1.64% yield to maturity, and an SEC yield of 0.73%. However it does carry an expense ratio of 0.35%, which I would consider a bit steep for a place to park cash. Mutual fund alternatives may be the Dodge & Cox Income Fund (MUTF: DODIX ) or the Fidelity Tax Free Bond Fund (MUTF: FTABX ) for taxable account investors. U.S. Treasury Securities My perennial favorite place to park cash is in U.S. Treasury securities, which can be bought in a variety of maturities allowing the investor to lock in higher rates for a longer period of time in a declining rate environment, or give them the opportunity to reinvest maturing securities at higher rates in a rising rate environment. In the current environment, I continue to be partial to the long term Zero Coupon U.S. Treasury bond, which I think holds a tremendous amount of value at current levels, and will likely benefit from the macroeconomic environment within which we find ourselves. I prefer individual bonds with maturity dates to lock in principal plus interest and a defined date of maturity. But for those who prefer ETFs the Vanguard Extended Duration Treasury ETF (NYSEARCA: EDV ) and the PIMCO 25+ Year Zero Coupon U.S. Treasury Index ETF (NYSEARCA: ZROZ ) are two options at the long end, and the PIMCO 1-3 Year U.S. Treasury Index ETF (NYSEARCA: TUZ ) and the PIMCO 3-7 Year U.S. Treasury Index ETF (NYSEARCA: FIVZ ) at the short end and belly of the curve respectively. Understand however, that owning ETFs instead of bonds with maturity dates, does expose investors to a greater amount of risk, and is not recommended for cash. Buying the U.S. Dollar A slightly more risky strategy is to buy the U.S. dollar in the currency market. If you are not a financial professional, there are several ETFs such as the PowerShares DB USD Bull ETF (NYSEARCA: UUP ) or the WisdomTree Bloomberg U.S. Dollar Bullish ETF (NYSEARCA: USDU ). Within the current economic environment, the U.S. seems to be the only country not trying to devalue their currency. Japan, as well as the entire Eurozone, and others continue to engage in policies that seek to devalue their currencies, thus making their goods cheaper. The currency wars are raging, and so is the U.S dollar’s value. In this environment, I expect the U.S dollar to continue its move upwards. Paying off Debt While not an overt place to stash your cash, paying off debt, especially within the context of investment leverage, will go a long way in ensuring investors meet their long term goals, and that they can survive hard times economically. As I stated above in a deflationary environment which I believe we are in globally, every dollar of debt strangles, while every dollar held gains value. The more dollars that can be averted from future debt payments allows the investor to take advantage of rock bottom prices in risk assets, as well as in the broader economy. Cash is king. Brokered CDs Brokered CDs are largely similar to the CDs you will find at your local bank. Many of them can be found through your broker, and offer yields as high as or higher than Treasury bonds in some cases. While I would not personally follow this course of action, it may be right for some investors, and deserves consideration. Conclusion In conclusion, the role of cash has largely been forgotten by many responsible for portfolio construction. I believe cash is an important asset class that is not to be ignored when times are good. In this piece we have explored some of the reasons to keep a steady allocation to cash, and where in the current economic environment to get a greater return on cash. In the end, if my assessment of the economic environment is correct, those with cash will be able to profit in a world of deflating prices. Disclosure: I am/we are long UUP, LONG TERM ZERO COUPON U.S. TREASURY BONDS. (More…) I wrote this article myself, and it expresses my own opinions. I am not receiving compensation for it (other than from Seeking Alpha). I have no business relationship with any company whose stock is mentioned in this article. Additional disclosure: This article is for informational purposes only and is not an offer to buy or sell any security. It is not intended to be financial or tax advice, and it is not financial or tax advice advice. Before acting on any information contained herein, be sure to consult your own financial or tax advisor.

