Tag Archives: transactionname

Ivy Portfolio August Update

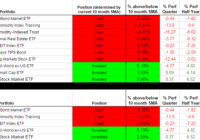
The Ivy Portfolio spreadsheet tracks the 10-month moving average signals for two portfolios listed in Mebane Faber’s book, The Ivy Portfolio: How to Invest Like the Top Endowments and Avoid Bear Markets . Faber discusses 5, 10, and 20 security portfolios that have trading signals based on long-term moving averages. The Ivy Portfolio spreadsheet tracks both the 5 and 10 ETF portfolios listed in Faber’s book. When a security is trading below its 10-month simple moving average, the position is listed as “Cash”. When the security is trading above its 10-month simple moving average, the positions is listed as “Invested”. The spreadsheet’s signals update once daily (typically in the late evening) using the dividend/split adjusted closing price from Yahoo Finance. The 10-month simple moving average is based on the most recent 10 months, including the current month’s most recent daily closing price. Even though the signals update daily, it is not an endorsement to check signals daily or trade based on daily updates. It simply gives the spreadsheet more versatility for users to check at his or her leisure. The page also displays the percentage each ETF within the Ivy 10 and Ivy 5 Portfolio is above or below the current 10-month simple moving average, using both adjusted and unadjusted data. If an ETF has paid a dividend or split within the past 10 months, then when comparing the adjusted/unadjusted data you will see differences in the percent an ETF is above/below the 10-month SMA. This could also potentially impact whether an ETF is above or below its 10-month SMA. Regardless of whether you prefer the adjusted or unadjusted data, it is important to remain consistent in your approach. My preference is to use adjusted data when evaluating signals. The current signals based on July 31st’s adjusted closing prices are below. This month the Vanguard Total Bond Market ETF (NYSEARCA: BND ), the SPDR Dow Jones International Real Estate ETF (NYSEARCA: RWX ), the Vanguard FTSE Emerging Markets ETF (NYSEARCA: VWO ), the PowerShares DB Commodity Index Tracking ETF (NYSEARCA: DBC ), the iShares S&P GSCI Commodity-Indexed Trust ETF (NYSEARCA: GSG ), the Vanguard REIT Index ETF (NYSEARCA: VNQ ) and the iShares TIPS Bond ETF (NYSEARCA: TIP ) are below their 10-month moving average. The spreadsheet also provides quarterly, half yearly, and yearly return data courtesy of Finviz. The return data is useful for those interested in overlaying a momentum strategy with the 10-month SMA strategy: (click to enlarge) I also provide a “Commission-Free” Ivy Portfolio spreadsheet as an added bonus. This document tracks the 10-month moving averages for four different portfolios designed for TD Ameritrade, Fidelity, Charles Schwab, and Vanguard commission-free ETF offers. Not all ETFs in each portfolio are commission free, as each broker limits the selection of commission-free ETFs and viable ETFs may not exist in each asset class. Other restrictions and limitations may apply depending on each broker. Below are the 10-month moving average signals (using adjusted price data) for the commission-free portfolios: (click to enlarge) (click to enlarge) Disclosure: None
Southern Company: A Stock For Income Investors

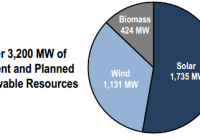
SO has been undertaking correct strategic initiatives by incurring capital spending to develop and strengthen power generation fleet. Company can opt to accelerate its capital spending targeted at renewable power sources. Southern expects to grow its long-term earnings in a range of 3%-4%. Dividend offered by SO stays secure, and the stock is a good investment prospect for income-hunting investors. Utility companies have remained a popular investment choice for income-seeking investors, as utilities offer attractive and solid dividends. In recent times, utility companies have accelerated their capital spending to expand and strengthen regulated operations. Also, utility companies have been scaling down unregulated operations, which will provide stability to their revenue and earnings. Southern Company (NYSE: SO ), which has a solid regulated asset base, stays an impressive investment prospect for long-term income investors, as it offers a solid yield of 5.1% . The company has been undertaking various construction projects and incurring capital investment to strengthen its regulated asset base, which will fuel its rate base and earnings growth in future. However, delays and cost overruns associated with the ongoing construction projects have inflated the company’s risk profile and will limit the upside to the stock price in the near term. The stock is trading at a slight discount to its peers on the basis of forward P/E, which I think is justified given risk delays and cost overruns. Financial Highlights and Stock Price Catalysts The company’s financial performance is backed by its regulated assets base; the company generates more than 90% of its earnings from regulated operations. Southern Company posted a strong performance for 2Q2015; EPS for the quarter came out to be $0.71 , ahead of consensus of $0.69 and the 2Q2014 EPS of $0.68. The performance for the second quarter was supported by rate increases, the strong performance of its subsidiary Southern Power and favorable weather conditions; total weather normalized sales increased by 1%. Also, the company enjoyed weather normalized growth for the second consecutive quarter in all of its three customer segments, including commercial, residential and industrial segments. The company maintained its 2015 EPS guidance range of $2.76-$2.88; however, I think given its strong first half performance, Southern will increase its EPS guidance range for 2015 in October during the 3Q2015 earnings call. The company has been making capital investments to strengthen its power generating fleet; the company plans to make capital spending of more than $16 billion from 2015 through 2017, which will allow its long-term earnings to grow in a range of 3%-4% . In addition, the company has been aggressively working to grow its renewable generation portfolio, and plans to have a renewable generation capacity of almost 3,200MW, including solar, wind and biomass. The company will continue to direct capital spending toward the expanding renewable energy portfolio to take advantage of the 30% solar investment tax credit before the end of 2016. Moreover, given the attractive regulatory environment for renewable capital spending, the company can opt to increase its capital spending for future years, which will positively affect its future earnings growth and the stock price. The following graph reflects the current and planned renewable resources for Southern. Source: Investors Presentation Despite the company’s strong regulated asset base, the ongoing construction of nuclear and coal gasification (IGCC) projects stay a concern for investors. The company’s nuclear project ‘Vogtle’ is on track, and unit 3 and unit 4 are expected to be in operation in 2Q2019 and 2Q2020, respectively; however, substantial construction work remains, and cost overruns and delays will weigh on the stock price. On the other side, the company registered another charge of $14 million for the Kemper project; the project is expected to be completed by 1Q2016. However, delays beyond 1Q2016 are expected to increase the project cost by $20-$30 million every month. Cost overruns and construction delays associated with the ongoing two construction projects have inflated Southern’s risk profile and will limit stock price appreciation in the near term, and the stock return will be dividend driven. The stock trades at a slight discount to peers, which I think is justified given the construction risk attached to the company; Southern is trading at a forward P/E of 15.20x , versus the utility sector’s forward P/E of 16.5x . In my opinion, the stock valuation will not expand and the stock will not trade in-line with its industry P/E multiple until the company’s construction project-related risk decrease or/and its EPS growth accelerates. Separately, the company’s management does not have any plans to issue equity until 2017 to finance its planned capital investments; however, if the company experiences delays and increases in construction costs, the management might revisit their financing assumptions and could consider to issue equity, which will adversely affect its EPS. Summation Southern Company has been undertaking the correct strategic initiatives by incurring capital spending to develop and strengthen its power generation fleet. Going forward, the company can opt to accelerate its capital spending targeted at renewable power sources, which will augur well for its long-term earnings growth; currently, Southern expects to grow its long-term earnings in a range of 3%-4%. Also, dividend offered by the company stays secure, and the stock is a good investment prospect for income-hunting investors, as it offers a yield of 5.1%. However, the construction risk will limit a stock price increase in the near term. Disclosure: I/we have no positions in any stocks mentioned, and no plans to initiate any positions within the next 72 hours. (More…) I wrote this article myself, and it expresses my own opinions. I am not receiving compensation for it (other than from Seeking Alpha). I have no business relationship with any company whose stock is mentioned in this article.

Let Them Eat Spreadsheets

Summary Numbers by themselves don’t tell us very much. Put another way, a text without a context can become a pretext. Because we don’t let sports teams make up their own rules as they play, we have certain standards that companies are supposed to go by when they report their earnings. Accounting isn’t “Calvinball.” By looking carefully at supporting ratios, and how they change over time, a careful analyst can sometimes sniff out whether a company’s earnings are real, or whether they’ve been enhanced by questionable accounting practices. Because financials are like a bathing suit: what they reveal is interesting, but what they conceal may be even more interesting. What good are financial statements? Most of us have a vague idea that Apple (NASDAQ: AAPL ) makes iPhones, that Panera (NASDAQ: PNRA ) runs restaurants, and that Wal-Mart (NYSE: WMT ) sells stuff. But how well do they do these things? Reports that Amazon (NASDAQ: AMZN ) earned 19 cents last quarter or that IBM (NYSE: IBM ) had sales of $20.8 billion leave us cold. Numbers by themselves don’t tell us very much. Put another way, a text without a context can become a pretext. Financial statements are intended to tell us what a company has (the balance sheet) and what the firm did with what it has (the income statement). They also disclose what management has done with its cash (the statement of cash flows). We need to know these things because ultimately any investment’s value is determined by how much cash it can generate for its investors, and how predictable (or unpredictable) this cash stream is. Because we don’t let sports teams make up their own rules as they play, we have certain standards that companies are supposed to go by when they report their earnings. Accounting isn’t ” Calvinball .” But electric utilities are different than banks, which differ from defense contractors. So management is allowed a little leeway as they apply the rules. Those choices, however, have to be reflected in the footnotes – usually “Footnote 1.” In order to make sense of the raw numbers, equity analysts use ratios to compare companies with each other. It’s notable that Apple had a 40% profit margin the last year, but that’s even more remarkable when you see that Microsoft’s (NASDAQ: MSFT ) margin was only 23%, and that Samsung’s ( OTC:SSNLF ) was just 10%. That may be one reason why Apple seems to be taking over the world. Source: Bloomberg Every year public companies have to hire outside accountants to examine their financial statements and verify that they’ve been playing by the rules. Although the financial news tends to report just one or two numbers each quarter – earnings per share and sales – there are lots and lots (and lots) of supporting statements that go into those. Businesses can be complicated, and disclosing their activities properly takes a lot of time and effort. Last year, GE’s (NYSE: GE ) annual financial statement was 247 pages long! By looking carefully at these supporting ratios, and how they change over time, a careful analyst can sometimes sniff out whether a company’s earnings are real, or whether they’ve been enhanced by questionable accounting practices. Because financials are like a bathing suit: what they reveal is interesting, but what they conceal may be even more interesting. Editor’s Note: This article discusses one or more securities that do not trade on a major U.S. exchange. Please be aware of the risks associated with these stocks. Share this article with a colleague