Tag Archives: transactionname

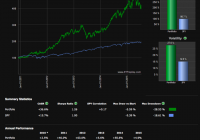
Does Cotton Correlate To Oil?

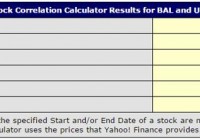
Summary We compared the top oil and cotton ETFs; BAL and USO. Updated on global supply and demand. Events that could influence the short-term price of cotton. In this article on cotton we are going to focus on oil prices vs. cotton prices. Polyester is a competitor of cotton and lower oil prices allow for lower polyester prices. How much does cotton correlate to oil prices? That is a hard question to answer, especially given the large swings cotton has seen over the past decade. These swings skew correlation data and are caused by other events, namely China’s build out of cotton reserves in 2011. What I will seek to do is remove those years from the data and see if there is a correlation or not. For purposes of correlation we will take a look at January 2012 to present. Today we will focus our discussion around the iPath Dow Jones-UBS Cotton Total Return Sub-Index ETN (NYSEARCA: BAL ). BAL correlates perfectly to the price of cotton. For more information on BAL and its perfect correlation to the sub index in which it tracks, please view this article . With reasonable fees and proper tracking it is your best vehicle to use when trading cotton. Below is a table comparing BAL to the United States Oil ETF, LP (NYSEARCA: USO ): (click to enlarge) Chart obtained from buyupside.com An even more interesting take on the data is when you compare the two ETFs side by side in a single chart. Notice the large drop in oil prices beginning in July of 2014. Despite the continuing plunge in oil prices, cotton fared well over the last year. The following table from iPath provides other correlations to BAL. (click to enlarge) The results show that cotton correlates to the price of oil more than any other index. There are many variances and the correlation is far from perfect, but significant enough to point out. The Outlook for Cotton In previous articles we reviewed the 2015 outlook for cotton ( see here ). Last month we took a look at how the flooding in Texas was providing temporary price support to cotton ( see here ). I believe the flooding in Texas only delayed planting and shouldn’t cause any substantial decrease in supply. Pricing did respond to this event but has since trended back down. Last week the World Agriculture Supply and Demand Estimates (WASDE) raised their midpoint average price received to 62 cents per pound, with a high of 70 cents and a low of 58 cents respectively. Now this does not provide much of an opportunity for investor as cotton is currently trading at around 65 cents per pound. Global Factors The global supply and demand estimates still indicate lower consumption and higher ending inventory (stocks). China has led the drop in consumption due to strong competition from polyester amid the low oil prices we talked about above. China continues to be a dominate force behind cotton prices. They have the world’s largest inventory of cotton and are the largest consumer followed by India. Both of these countries export the majority of cotton they consume after manufacturing it into various clothing and discretionary items. The global economy, especially that of the United States and other consumer nations, should remain on the watch list of any cotton investor. Consumption aids in the demand for cotton. Production (click to enlarge) Table retrieved from the U.S. Dept. of Agriculture Farmers around the world continue to choose more profitable crops over cotton, especially here in the United States. I predicted this in my 2015 outlook for cotton. It really is a no brainer if you think about it. If you have multiple businesses to choose from, you would pick the one you think would be the most successful; the same thing farmers do. Conclusion I would say the biggest catalyst for cotton in the short-term would be a rebound in oil prices. Other possible events include natural disasters such as a hurricane hitting Texas. On simply a supply and demand perspective current market conditions look slightly weak. I look forward to continuing coverage on BAL and will put together a 2016 outlook within the next several months. If anything changes you can expect an update about it here on Seeking Alpha. I am assigning a neutral rating on BAL going forward and I do not see any reasons, other than those mentioned about, to recommend it as a buy at this time. Going into 2016 I see a slight trend upward as farmers balance stocks and hopefully global consumption picks up. Thank you for reading and I wish you a profitable rest of 2015. Disclosure: I/we have no positions in any stocks mentioned, and no plans to initiate any positions within the next 72 hours. (More…) I wrote this article myself, and it expresses my own opinions. I am not receiving compensation for it (other than from Seeking Alpha). I have no business relationship with any company whose stock is mentioned in this article.

Improving Basic Structural Arbitrage

Adding long dollar index exposure is highly logical. It reduces the strategy index’s correlation to bonds. And it provides multiple forms of statistical hedging. As long time readers know, the idea behind Structural Arbitrage is that profits are possible by acting as a synthetic insurance company which sells expensive insurance in the volatility market, and then synthetically reinsures that market risk with long duration government bonds. To review, here are the basic strategy index’s rules: I. Buy XIV (NASDAQ: XIV ) with 40% of the dollar value of the portfolio. II. Buy TMF (NYSEARCA: TMF ) with 60% of the dollar value of the portfolio. III. Rebalance weekly to maintain the 40%/ 60% dollar value split between the positions. XIV is the inverse short term volatility ETN. TMF is the 3X leveraged 20+ year government bond ETF. Here are the strategy’s results in a linear scale: (click to enlarge) For those of you who don’t believe that such a simple strategy index could work, I made the strategy public in an ebook back in 2013. If a relationship is robust, it can still make money even if it is widely studied. The potential problem, though, is the correlation of the strategy to bonds, as we can see in the graph below which compares the strategy to its TMF component: (click to enlarge) Even though the R squared value of a 0.61 correlation to TMF isn’t horrible, it’s not great either. And as I’ve said again and again , I believe that the strategy in its original form should be abandoned, due to the risk of a prolonged bear market in bonds. A simple improvement would be to add long dollar index exposure through an instrument such as UUP. The logic is “if then” logic. If interest rates rise, TMF will fall, but the dollar might strengthen, since the higher yield makes dollars more attractive than alternatives. What exactly would an improvement consist of? Here are the improved strategy’s rules: I. Buy XIV (NASDAQ:) with 15% of the dollar value of the portfolio. II. Buy TMF (NYSEARCA:) with 15% of the dollar value of the portfolio. III. Buy UUP (NYSEARCA: UUP ) with 70% of the dollar value of the portfolio. IV. Rebalance annually to maintain the 15%/ 15%/70% dollar value split between the positions. Here are the strategy’s results in a linear scale: (click to enlarge) The strategy now lags the S&P by 1.1% per year, but the drawdown is reduced by almost 8 percentage points, far improving the CAGR/Max drawdown ratio, called the MAR, compared to that of S&P 500. Let’s take a look at the correlation of the strategy to its long bond TMF component: (click to enlarge) The improved strategy index’s correlation to TMF dropped from 0.61 to 0.35. And the improved strategy index’s correlation to the S&P 500 is only 0.13 (pretty amazing) dropping from an already impressive 0.17 level. For the investor who is looking for a return stream which is largely uncorrelated to stocks and uncorrelated to bonds , this improved strategy index is pretty neat. Both long bonds and long dollar index exposure can often statistically hedge short volatility exposure. The lesson here is that multiple forms of hedging are usually better if the goal is robustness and non-correlation. Thanks for reading. Disclosure: I/we have no positions in any stocks mentioned, but may initiate a long position in XIV, TMF, UUP over the next 72 hours. (More…) I wrote this article myself, and it expresses my own opinions. I am not receiving compensation for it (other than from Seeking Alpha). I have no business relationship with any company whose stock is mentioned in this article.

Look To Taiwan For Stability And Low Valuation

Summary The iShares MSCI Taiwan ETF has extremely low valuation at the moment. Taiwan experienced a large drop in exports in June, while exports are expected to begin increasing in the 3rd quarter of 2015; this has created a buy opportunity. Taiwan is a very stable country to invest in; there has been conservative economic growth, low inflation, consistent trade surpluses, and negligible exchange rate movements. In previous articles, I have mentioned investment opportunities into fast growing economies such as the Phillipines and Indonesia through ETFs, and believe these regions have ample potential. However, Taiwan presents itself as a more stable investment option, and valuation is extremely attractive at the moment. I have decided to turn my attention to the iShares MSCI Taiwan ETF (NYSEARCA: EWT ), as a means for investors to gain exposure to Taiwan. GDP Growth GDP growth in Taiwan can be characterized as very consistent and moderate. Future projections provide the same results more or less, with a slightly more beneficial outlook; GDP growth is expected to rise 2.7% year on year until 2019 . Other forecasts, after assessing China’s threat to Taiwan’s exports, have lowered GDP growth projections from 3.78% to 3.28% in 2015 . The benefit with Taiwan thus can be characterized as stability, coupled with moderate and consistent growth projected for the future. (click to enlarge) Source: Trading Economics. FX Risks One benefit of investing in Taiwan is its extremely stable currency and low inflation rate. The exchange rate movement for this currency has been negligent, with an average rate of 31.25 since 1979, and has most recently been consistently close to 30 in recent years. Inflation has also been very low, and has mostly recently been -0.56% in June 2015. Towards the end of 2015, inflation averaged between 0.6% to 2%. Taiwan has the comparative advantage of low inflation and negligent exchange rate movement, when compared to other countries in Asia. The rise of Taiwan’s currency, which is rising faster than Japan, South Korea, and China, does present a threat to its tech exports , as this contributes vastly to its economy. Consistent Trade Surplus As a strong tech export country, it is favorable to note that Taiwan’s balance of trade has been on the rise in recent years. Projection for future balance of trade in Taiwan provides mixed results: Demand from developed markets continues to improve, mainly in the USA and Europe. This is balanced with caution, as the demand from emerging countries such as China has been decreasing. June has been a particularly challenging month for Taiwan, as export demands decreased by 13.9% , the largest decrease since February of 2015. (click to enlarge) Source: Trading Economics. Exports in Taiwan are projected to grow at a moderate rate for the next year. TWD Million Last Q3 2015 Q4 2015 Q1 2016 Q2 2016 Exports 709,860 752,876 755,280 754,089 751,775 Investors wishing to profit off of growth in exports, may find it beneficial to develop a short strategy, by waiting until the 4th quarter of 2015 when exports increase by 6.4%. While exports do not have substantial potential for growth based on these projections, having moderate growth in an export heavy country, with a stable currency and low inflation, makes this investment very conservative. Moreover, the valuation is incredibly low, and investors may determine it beneficial to hold this stock longer, and to choose a higher exit P/E. Economic Cooperation Framework Agreement The Economic Cooperation Framework Agreement , a significant trade deal completed with China in 2010, has already proved to be a catalyst for economic growth; the agreement has not been able to expand beyond its initial stages, due to protests beginning in March last year. The agreement was created to reduce tariffs and commercial barriers between the two countries. Currently, statistics have shown that the trade agreement has saved Taiwan $2.4 billion on tariffs and could boost the country’s GDP by 1.5% if fully implemented. With decreased demand from China and high dependency on exports for revenue, the full implementation of this agreement clearly has the ability to give Taiwan’s economy the boost necessary to achieve further growth. Taiwan Stock Market One last benefit of investment in Taiwan has been the consistent rise of the stock market since late 2014, coupled with the recent index plunge beginning in May of 2015. The Taiwan Stock Market is expected to increase to 9,390.06 points in 2016 , which represents a 5.3% increase. A moderate increase in the TSWE will be attractive, especially after examining the fast financial performance of the fund’s holdings later in this article. (click to enlarge) Source: Trading Economics. Diverse Growth Taiwan has had substantial growth in a wide variety of industries and areas in 2015: Taiwan’s industrial production index gained 6.49% year on year in March of 2015. During this time, construction also grew by 15.06%, and manufacturing of electronic components rose by 11.41%. Machinery and Equipment grew by 14.4% and chemical materials rose by 13.6%. Food services and retail both gained 1.9% and 1.3% respectively. Consumer spending has been significantly increasing since 2012, with a most recent annual increase of 2% in the 1st quarter of 2015. Taiwan’s manufacturing sector also reached an all time high in 2014, with a 3.5% year on year increase in revenue . Increased consumption and exports from Taiwan’s tech sectors have all contributed to the country’s economic growth. Moreover, increased wages has also been a catalyst for increased consumer spending, further contributing to economic growth. Taiwan has a strong advantage as a high tech export company, that domestically also has a very favorable outlook. While it is certainly not at its most strategic growth point, there is still growth ahead, and investors can feel confident regarding the country’s past economic performance. Moreover, the growth in manufacturing in Taiwan is crucial, as this will be another factor that will boost the economy and increase consumer’s confidence. Buy Opportunity EWT data by YCharts Things started to look less favorable in Taiwan beginning in June, when industrial production dropped -3.18%, as oppose to the 1.21% gain anticipated. As previously mentioned exports also decreased substantially during this month, at a two year record low. Poor performance in June attributed to the drop in the fund price; this creates a short term opportunity for the anticipated increase in exports and also an opportunity for long term investors to take advantage of the low valuation this has created. Price/Earnings 12.93 Price/Book 1.74 Price/Sales 0.94 Source: Yahoo Finance . Conclusion While Taiwan certainly has major threats ahead and will be no means among the fastest growing economies, the country can be characterized as a conservative country to invest in, that has acceptable levels of growth ahead. The current valuation of this fund is a key reason to invest in Taiwan at the moment, while investing in equity in Taiwan with higher valuation is not a very strategic investment objective; the economic environment in Taiwan is favorable, but there is not enough growth ahead to justify investing in companies with moderate or high valuation. Therefore, the investment approach to Taiwan should be considered accordingly, as it may not be the best environment for long term investment. Unless there is a considerable boost in Taiwan’s position as a tech export country, with increased exports to emerging countries specifically, it is best to sell this fund once the valuation is high or even average. Disclosure: I/we have no positions in any stocks mentioned, and no plans to initiate any positions within the next 72 hours. (More…) I wrote this article myself, and it expresses my own opinions. I am not receiving compensation for it (other than from Seeking Alpha). I have no business relationship with any company whose stock is mentioned in this article.