Tag Archives: transactionname

Avista Corporation: Solid, But Price Not Spectacular

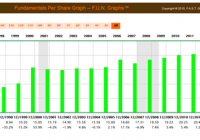
Summary Avista Corp has demonstrated a history of solid fundamental performance. There are currently a couple positive factors – mostly favorable rate case settlements – which should support earnings estimates going forward. Shares seem fairly priced at current levels – not a spectacular discount, but not overpriced, either. The Thesis The thesis here is that Avista (NYSE: AVA ) is a solid company in the utilities space with a history of solid fundamentals. While there are several specific company challenges, there are also some positive trends which should make earnings estimates realistic. At current share price levels (about $32), shares seem priced close to valuation. While not a screaming discount at the moment, this company may fill a need in a portfolio looking for dividend income and long-term growth. This article will review historical performance of company fundamentals, including past trend per-share results for book value, earnings, revenue, and debt. Several company-specific positive trends and challenges will be presented, and a suggested company valuation will be provided. Lastly, two specific strategies will be offered for consideration. Avista Corp: History of Fundamental Performance As usual I find my F.A.S.T. Graphs subscription to be very valuable to study a company’s fundamentals. Using the “F.U.N. Graphs” feature allows a visual of each company fundamental. To assess the trend of fundamentals for AVA, I chose to review metrics going back 20 years. This historical view gives evidence of management success or struggles in growing these particular fundamentals over time. Book Value Per Share Trends The ideal for this metric is a trend of steadily rising book value per share. Why? This number is difficult to manipulate and a rising metric suggests management has made decisions to add value over time. In my view, AVA demonstrates very effective growth of this metric, as demonstrated by the growing green bars over time. (click to enlarge) source: fastgraphs.com Earnings History In order to conduct a reasonable valuation analysis, earnings are a key metric to consider. Historical earnings are worthy of review, in my opinion, because a person gets data on consistency over time and several cycles. Of course the idea is for the company to generate consistent earnings growth over time. As the graph below seems to illustrate, AVA has delivered earnings over time. My read of this graph is that earnings are generally predictable, but not spectacularly so. Overall, given this space and how the company performs relative to peers, in my view AVA demonstrates a reasonable earnings growth historical track record. (click to enlarge) source: fastgraphs.com Revenue History As would be expected in this industry, revenue (not considering the anomaly in 1999) has been quite consistent. And given the company’s recent success with rate settlements, there is no reason to believe these trends will not remain supported for the foreseeable future. (click to enlarge) source: fastgraphs.com Debt The idea here is to review debt to gain a perspective on use of debt over time to finance company obligations. In my opinion, AVA has utilized debt as one would expect in this industry and management has delivered results which position the company well for the future. (click to enlarge) source: fastgraphs.com In my humble opinion, based on the data Avista Corp management has delivered a solid foundation of fundamental metrics over time. This suggests a level of predictability and offers balance sheet strength to build upon in the future. Company-Specific Trends This article suggests that AVA is about fairly priced right now – neither excessively overvalued or extremely undervalued. As one considers trends or issues that may impact earnings going forward, the following seem relevant: (sources include the company web-site, earnings calls and 10-k) Positive Trends The company is getting the benefit of the Alaska Electric Light & Power acquisition last summer Rate case settlements suggest earnings will increase for this year and 2016 Management continues guidance for consolidated earnings to be in the range of $1.86 to $2.06 per diluted share The board of directors raised the dividend for the first quarter Challenges AVA operates in a highly regulated environment – this tends to add costs and time to various initiatives Weather and costs are always a bit unpredictable; the weather affects sales as well as the cost of natural gas and supply power Energy resource risk management can affect earnings – the company hedges some commodity pricing costs and this can cause variability based on fluctuations All things considered, in my opinion AVA is well aware of the challenges of the environment and is doing an effective job to address those challenges going forward. The results are in the past fundamental performance and estimated results for the future. But what about the price to value relationship? This article suggests AVA is priced about to value. Let’s have a look at some data to substantiate this view. A Valuation Method When valuing a company, I like to compare that company against its own historical valuation. Again a F.A.S.T. Graphs subscription is an excellent tool to visually demonstrate the history of a company’s own valuation past record. In the chart below, the orange line represents earnings history and what could be considered “fair valuation” at a price/earnings multiple of 15X. The blue line represents an historic normalized average PE. Finally, the black line is the market price of AVA. Note that a normal PE for AVA over the past 20 years has been 15.7X earnings. When considering just the past 8 years since the Great Recession, the normal PE ratio has been about 15X earnings. Today AVA is priced at 16.5X earnings. Visually, the graph demonstrates this data well: first, notice how historically the market price (black line) follows the valuation line (blue PE line). And notice how today the black line (market price) is very near historical valuation lines. (click to enlarge) source: fastgraphs.com What Might Be A Strategy to Consider? AVA seems to present a potential opportunity for a person seeking dividend, but not expecting excessive upward price movement. If an individual desired to take a position, it may be reasonable to begin a position (albeit not 100% of the entire allocation to this company) at these levels. Alternatively, a person could consider selling puts (at a strike price below the current market price) as a possible way to either a)keep the premium if AVA rises or b)purchase shares at a discount from the price today. All of the above in my opinion offered for your consideration. Thank you very much for your time. Disclosure: I/we have no positions in any stocks mentioned, and no plans to initiate any positions within the next 72 hours. (More…) I wrote this article myself, and it expresses my own opinions. I am not receiving compensation for it (other than from Seeking Alpha). I have no business relationship with any company whose stock is mentioned in this article.

Best3x4 Variable Asset System With Minimum Volatility Stocks Of The S&P 500

Summary This model can hold 3 to 12 stocks, at variable weightings, selected by a ranking system from a minimum volatility stock universe of the S&P 500. The model has 12 equally weighted slots; a very high ranked stock could occupy a maximum of 4 slots, that is a nominal 33% weighting of the model’s total assets. When adverse stock market conditions exist, the model reduces stock holdings by 35% and invests the proceeds in SDS. The backtest produced a simulated average annual return of about 36% from Jan-2000 to end of June-2015 with a maximum draw-down of minus 22%. The Minimum Volatility Stock Universe of the S&P 500 Minimum volatility stocks should exhibit lower drawdowns than the broader market and show reasonable returns over an extended period of time. It was found that a universe of stocks mainly from the Health Care, Consumer Staples and Utilities sectors satisfied those conditions. This minimum volatility universe of the S&P 500 currently holds 117 large-cap stocks (market cap ranging from $4- to $277-billion), and there were 111 stocks in the universe at the inception of the model, in Jan-2000. Trading Rules The ranking system employed is the same as for our Best8(S&P500 Min-Volatility) system, but the trading system differs in regard to the hedge used and some additional sell rules. The model assumes that stocks are bought and sold at the next day’s average of the Low and High price after a signal is generated. Variable slippage of about 0.12% of a trade amount was taken into account to provide for brokerage fees and transaction slippage. Buy Rules: Some of the largest market cap stocks are exclude from being selected. Sell Rules: Rank Keep the weight of a position in a slot to +10% and -15% of the nominal weight. Realized Trades Analysis An analysis of all the realized trades is shown in Table 1. There were 749 winning trades out of 1116, resulting in a win rate of 67.1%. The average yearly turnover was about 370%. On average a position was held for 78 days. Holdings The models can potentially hold a maximum of 12 different stocks, and a minimum of 3 different stocks. As of July 15 it held 8 different stocks with various weights as shown in Table 2. Performance In the figures below, the red graph represents the model and the blue graph shows the performance of benchmark SPY. The backtest period was 15.5 years, from January 2000 to June 2015. Figures 1 to 5 show performance comparisons: Figure 1: Performance 2000-2015 with market-timing and hedging with long SDS. The model uses a hedge ratio of 35% of current holdings during down-market conditions. (Note: The inception date of SDS was Jul-2006. Prior to this date values are “synthetic”, derived from the S&P 500.) Annualized Return= 36.1%, Max Drawdown= -21.8%. Figure 2: Performance 2000-2015 without hedging. Annualized Return= 34.2%, Max Drawdown= -22.9%. Figure 3: Performance 2000-2015 without hedging and market timing. Annualized Return= 27.8%, Max Drawdown= -49.8%. Figure 4: Performance Jan-2000 to Jun-2015 . Annualized Return= 39.7%, Max Drawdown= -21.5%. Figure 5: Performance Jul-2014 to Jun-2015. Total Return= 58.8%, Max Drawdown= -7.3%. This can be directly compared with our Best12(NYSEARCA: USMV )-Trader model’s return of 28.6% for the same time period. (click to enlarge) (click to enlarge) (click to enlarge) (click to enlarge) (click to enlarge) (click to enlarge) (click to enlarge) (click to enlarge) (click to enlarge) (click to enlarge) Figures 6 to 10 show performance details from Jan-2000 to Dec-2014 for the model with hedging and market timing: Figure 6: Performance versus SPY. Over the 15-year period $100 invested at inception would have grown to $9,170, which is 50-times what the same investment in SPY would have produced. Figure 7: 1-year returns. Except for 2006 the 1-year returns were always higher than for SPY. Figure 8: 1-year rolling returns. The minimum 1-year rolling return of the 3-day moving average was -5.8% early in 2007. Figure 9: Distribution of monthly returns relative to SPY. Figure 10: Risk measurements for 15.5-years and trailing 3-year periods. (click to enlarge) (click to enlarge) (click to enlarge) (click to enlarge) (click to enlarge) (click to enlarge) (click to enlarge) (click to enlarge) Following the Model This model can be followed, exclusively, live at iMarketSignals where it will be updated weekly together with our other trading models. It will not be available as a subscription model at Portfolio 123. Disclaimer One should be aware that all results shown are from a simulation and not from actual trading. They are presented for informational and educational purposes only and shall not be construed as advice to invest in any assets. Out-of-sample performance may be much different. Backtesting results should be interpreted in light of differences between simulated performance and actual trading, and an understanding that past performance is no guarantee of future results. All investors should make investment choices based upon their own analysis of the asset, its expected returns and risks, or consult a financial adviser. The designer of this model is not a registered investment adviser.

LS Opportunity Fund Changes Sub-Advisor, Objective, Strategy

By DailyAlts Staff There have been a number of changes to the LS Opportunity Fund (MUTF: LSOFX ) over the past several months. On April 23, the fund’s Board of Trustees filed paperwork with the SEC announcing the termination of the fund’s sub-advisory relationship with Independence Capital Asset Partners. According to sources, this change was due to the retirement of Jim Hillary, a portfolio manager on the fund and Chairman, CEO and CIO of Independence Capital Asset Partners. In addition to Mr. Hillary’s retirement, the firm will be returning capital to his hedge fund investors. Following the termination of Independence, the fund appointed Prospector Partners, LLC, a Connecticut based asset manager, as an interim sub-advisor and transitioned the portfolio to Prospector on May 28. Shareholders are being asked to approve Prospector as the sub-advisor, along with additional changes to the fund as outlined below, at the upcoming shareholder’s meeting on September 17. Changes to Fund Objectives and Implementation Now the LS Opportunity Fund is planning changes to its investment objective and strategy, as well as giving its advisor more power to hire and fire sub-advisors. According to a July 15 SEC filing, these changes will not result in higher fees for investors, nor will they alter the long/short equity orientation of the fund’s strategy. There is, however, a moderate change to the implementation of that strategy, which will now allow the fund to combine long positions with shorts of two or more stocks in the same sector, whereas previously, it called for “pair trades” of one long and exactly two shorts. The fund’s investment objective has also been slightly revised, with the new objective “to seek to generate long-term capital appreciation by investing in both long and short positions within a portfolio consisting of primarily publicly-traded common stock, with less net exposure than that of the stock market in general.” Formerly, the word “risk” appeared in place of “net exposure” in the fund’s stated objective. Fund Performance The LS Opportunity Fund, which launched in September 2010, has a three-star rating from Morningstar. For the three-year period ending June 30, the fund returned 7.76%, ranking it in the top 38% of funds in its Morningstar category. More recently, however, the fund’s returns haven’t been as strong: Year-to-date, through June 30, the LS Opportunity Fund’s -3.57% returns ranked in the bottom 13% of long/short equity funds. For more information, view a copy of the fund’s prospectus .