Tag Archives: transactionname

June 2015 U.S. Fund Flows Summary

Volatility was on the rise in June. At the beginning of the month rate-hike worries plagued many investors after an upbeat jobs report raised the possibility of an interest rate hike this fall. The Labor Department reported that the U.S. economy had added a better-than-expected 280,000 jobs for May. Despite a rise in the unemployment rate to 5.5%, many pundits felt the Federal Reserve would be more likely to raise interest rates sooner rather than later. However, European equities showed signs of weakness, and investor handwringing began in earnest as investors contemplated the looming deadline for Greece to make its first debt payment to the IMF at the end of June. And while early in the month the Shanghai Composite rose above the 5,000 mark to its highest level since January 2008, on Friday, June 19, the Shanghai Composite posted its worst week in more than seven years as investors bailed on some recently strong-performing Chinese start-ups. Worries of high valuations and record levels of margin debt sparked the exodus. Investors’ trepidations were not easily dispelled, and by mid-month more talk about a Greek exit (“Grexit”) from the Eurozone and anxiety before the Federal Open Market Committee’s June meeting led to further selloffs in the equity markets. For June the Dow Jones Industrial Average, the S&P 500, and the NASDAQ were in the red, losing 2.17%, 2.10%, and 1.64%, respectively, while a strong small-caps rally helped send the Russell 2000 up 0.59%. For the second consecutive month investors were net purchasers of fund assets, injecting $8.9 billion into the conventional funds business (excluding ETFs) for June. For the second month in a row money market funds-taking in some $8.7 billion for June-witnessed the largest net inflows of the three broad asset classes. Stock & mixed-asset funds took in $7.7 billion for the month. And, for the first month in six mutual fund investors were net sellers of fixed income funds, redeeming $7.5 billion from the macro-group for June. Despite hitting multiple record highs and triple-digit lows in June, the markets were generally in a sideways pattern for the month. While the Russell 2000 and the NASDAQ Composite managed to break into record territory in mid-June, advances to new highs were generally just at the margin. However, at June month-end concerns about the Greek debt drama, looming U.S. interest rate increases, Puerto Rico’s inability to service its public debt, and China’s recent market gyrations weighed heavily on investors. U.S. stocks took a drubbing in the last week of the month as investors dumped risky assets after negotiations between Greece and its creditors collapsed. The Dow witnessed its largest one-day point loss in more than two years on June 29. A positive finish for equities on the last trading day of June wasn’t enough to offset the Greek debt-inspired meltdown from the prior day, and many of the major indices witnessed their first quarterly loss in ten, with the Dow and the S&P 500 losing 0.88% and 0.23%, respectively, for Q2 2015, while the NASDAQ Composite gained 1.75%. For June the dollar lost ground against the pound (-2.84%), the euro (-1.47%), and the yen (-1.47%). Commodities prices also declined, with near-month gold prices dropping 1.54% to close June at $1,171.50/ounce. Front-month crude oil prices declined 1.38% to close the month at $59.47/barrel. Despite the rise in volatility toward month-end, the ETF universe witnessed its fifth consecutive month of net inflows, taking in some $17.6 billion for June. For the fourth month running authorized participants (APs) were net purchasers of equity ETFs, injecting $19.7 billion; however, for the second consecutive month APs were net redeemers of bond ETFs-removing $2.1 billion for June. Shrugging off the on-again, off-again nature of the Greek debt drama, the volatile Chinese market, and a resurgence of news surrounding the possible default by Puerto Rico of its sovereign debt, for the fifth month in a row APs’ appetite for World Equity ETFs remained high. The macro-classification witnessed the strongest inflows (+$9.6 billion) of Lipper’s five equity-related macro-classifications, followed at a distance by U.S. Diversified Equity ETFs (+$5.8 billion), Sector Equity ETFs (+$4.3 billion), and Mixed-Asset ETFs, which attracted some $105 million for the month. The Alternatives ETFs macro-classification (-$146 million) suffered the only net outflows for the month.
RPV Is A Strong ETF For Exposure To The Value Portion Of SPY

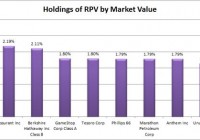
Summary The performance of the ETF has been fairly solid. The standard deviation gives it some risk, but not too much. The holdings of the ETF are at least adequately diversified and I like the positions. The decent liquidity doesn’t hurt when investors want to rebalance their portfolios. The Guggenheim S&P 500® Pure Value ETF (NYSEARCA: RPV ) has surprised me. With a higher turnover ratio and expense ratio, the fund has thoroughly outperformed SPY since inception. During the time frame I used for my regression, RPV was up 119% relative to the SPDR S&P 500 Trust ETF (NYSEARCA: SPY ) being up 96%. Impressive work and great for the people that decided to buy into it when the ETF started. What does RPV do? RPV attempts to track the investment results of S&P 500 Pure Value Index. The ETF falls under the category of “Large Value” presently, but was classified under “Mid-Cap Value” previously. The category may be prone to change as the ETF has a 25% portfolio turnover. Does RPV provide diversification benefits to a portfolio? Each investor may hold a different portfolio, but I use SPY as the basis for my analysis. I believe SPY, or another large cap U.S. fund with similar properties, represents the reasonable first step for many investors designing an ETF portfolio. Therefore, I start my diversification analysis by seeing how it works with SPY. The correlation is about 88.86%, which is low enough to allow more diversification benefits than I would expect in a fund referencing the S&P 500. Standard deviation of monthly returns (dividend adjusted, measured since March, 2006) The standard deviation is terrible. If investors want to ensure that they are keeping volatility out of their portfolio, this won’t be the ETF. That’s a little ironic to me because over long sample periods I wouldn’t expect a value ETF to show so much more volatility than SPY. For the period I’ve chosen, the standard deviation of monthly returns was 7.021%. For SPY, it was 4.416% over the same period. Mixing it with SPY I also run comparison on the standard deviation of monthly returns for the portfolio assuming that the portfolio is combined with the S&P 500. For research, I assume monthly rebalancing because it dramatically simplifies the math. With a 50/50 weighting in a portfolio holding only SPY and RPV, the standard deviation of monthly returns across the entire portfolio is 5.566%. If the position in SPY is raised to 80% while RPV is used at 20% the standard deviation of monthly returns drops down to 4.824%. In practice, I think the best way to use RPV is a position smaller than 20% and used in a diversified portfolio. The moderate correlation makes a strong case for using RPV in a small position so the volatility has less impact on the overall portfolio. At 5%, the standard deviation of the portfolio would have been 4.510%. Compared to SPY at 4.416%, this is a fairly low increase in the risk level measured by the standard deviation. Why I use standard deviation of monthly returns I don’t believe historical returns have predictive power for future returns, but I do believe historical values for standard deviations of returns relative to other ETFs have some predictive power on future risks and correlations. Yield & Taxes The distribution yield is 1.98%. It’s a little on the low side for the value focus, but not too low if it is only being considered for a portion of the portfolio. Due to the higher volatility of returns on this “value” ETF, I really appreciate seeing a higher distribution yield. The major risk, in my opinion, is that investors tend to withdraw their money at the worst possible times. Expense Ratio The expense ratios are both running .35%. It isn’t too bad and seems to be the standard for Guggenheim ETFs. I’d prefer lower, but this is still within reason. Market to NAV The ETF is trading at a .06% discount to NAV currently. I think any ETF is significantly less attractive when it trades above NAV and more attractive below NAV. A .06% discount is not enough to matter though. Investors should check prior to placing an order, but the liquidity in RPV should be a great hedge against any meaningful premiums or discounts. Lately there have been more than 120,000 shares trading hands each day. With each share over $50, the resulting liquidity is enough that I would have no concerns. Largest Holdings The diversification is pretty good. I see nothing to complain about here. (click to enlarge) Conclusion RPV delivers a strong showing in my initial assessment. The liquidity is excellent and the correlation is about what I would expect for the ETF having a focus on the S&P 500 index. The performance was fairly solid over the test period in every regard. The biggest weakness would have to be the volatility of returns, but that sure won’t stop the ETF from reaching the next stage. The Guggenheim S&P 500 Pure Growth ETF (NYSEARCA: RPG ) tracks the other side of the index, having a focus on growth stocks. The interesting thing is over the last five years both RPV and RPG significantly outperformed SPY. If we limit the comparison to the last 5 years, SPY was up 111.5%, RPG was up 148.2% and RPV was up 134%. When I looked up the ETF they were holding 119 of the constituents of the S&P 500. Frequently the contenders for the value exposure in my portfolio will have fairly strong dividend yields. The yield on RPV isn’t that strong, but that seems like a fairly minor issue for me since I don’t anticipate any withdrawals from the portfolio for a long time. Within the 119 companies, the diversification isn’t bad. Only one holding was over 2.02% and I can’t complain about the selections. All around, I feel like this is a fairly solid group of companies the ETF is holding. The expense ratio is not too bad, cheaper than most though a certainly higher than my goals. I’m certainly willing to deal with that if the ETF fits nicely into my overall portfolio. Disclosure: I/we have no positions in any stocks mentioned, and no plans to initiate any positions within the next 72 hours. (More…) I wrote this article myself, and it expresses my own opinions. I am not receiving compensation for it (other than from Seeking Alpha). I have no business relationship with any company whose stock is mentioned in this article. Additional disclosure: Information in this article represents the opinion of the analyst. All statements are represented as opinions, rather than facts, and should not be construed as advice to buy or sell a security. Ratings of “outperform” and “underperform” reflect the analyst’s estimation of a divergence between the market value for a security and the price that would be appropriate given the potential for risks and returns relative to other securities. The analyst does not know your particular objectives for returns or constraints upon investing. All investors are encouraged to do their own research before making any investment decision. Information is regularly obtained from Yahoo Finance, Google Finance, and SEC Database. If Yahoo, Google, or the SEC database contained faulty or old information it could be incorporated into my analysis.

Commodity Returns: So Much For The ‘Reversion To The Mean’ Trade

In 2014, I managed to avoid the energy sector for clients, almost entirely, owning no energy (crude oil or natural gas) companies and selling Halliburton (NYSE: HAL ) near $70 during the summer of 2014. Unfortunately, like a golfer that eagles one hole, and then takes a 9 on a par 3, the basic materials holdings for clients coming into and out of the summer of 2014 were: a) Alcoa (NYSE: AA ) (aluminum) b) US Steel (NYSE: X ) (steel) c) Freeport Copper (Copper and Energy) d) Peabody Energy (NYSE: BTU ) (and for the granddaddy of all disasters, coal) Here is what piqued my interest in the group and kept me long the names for so long. Although I haven’t owned gold for clients since late 2011, commodities and gold have been at the bottom of the “asset class return” table for three years running, i.e. 2012 through 2014, and managed to move up one slot through the first 6 months of 2015. Today, gold is getting killed again. When I think of the “reversion to the mean” trade today, the old saying “timing is everything” still matters too. 1) The dollar is stronger once again, the last few weeks, breaking the downtrend line in place since mid-March ’15, which is a negative for gold and commodities. 2) China is a mess both producing a LOT of its commodities and given the supposed slower growth, likely consuming less too. 3) I’ve always felt that the commodity complex and the emerging markets, given their commodity-based economies, seemed to be closely correlated, and the EEM (emerging markets ETF) looks ready to roll over again and trade down to $35. We were long for clients some of the base metals companies waiting for a “return-to-global-growth” theme, and the trade didn’t work. Looking at the past 35 years, from 1980 through 2015, the only time these stocks worked for a decent period of time was the early 2000s through 2007, when China was growing 15% per year. US Steel traded up to $180 by mid-2008 and promptly came right back down. Peabody Energy traded up to $82 and is now $1.50 per share. Freeport Copper traded as high as $62 in mid-2008. Basic materials, of which chemicals is the largest weighting at 70%-75% of the sector, is just 3% of the S&P 500 by market cap and earnings weight, so these base metals companies are a pretty small component of the overall index. Next time, I do think we will eliminate the operating risk of commodity companies, and stick with pure-play commodity ETFs, like we did with GLD. In the early 2000s, when gold bottomed right when the tech and growth stock bubble peaked, the only way investors could get exposure to gold was to buy Newmont Mining (NYSE: NEM ) or other gold miners. The GLD, when the ETF was launched in late 2005, was a much better way (in my opinion) to play gold than the operating companies. If readers have a favorite commodity ETF that you think is worth mentioning, send a note and I’ll give it a look please. Given the asset class returns table, “relative” investors can’t ignore the commodity complex.