Tag Archives: transactionname

Global X Serves Up A New Alternative ETF

By DailyAlts Staff Global X Funds has a growing line of “SuperDividend” ETFs, and the latest is sure to be of interest to liquid alts investors: the Global X SuperDividend Alternatives ETF (NASDAQ: ALTY ) , which began trading on the Nasdaq on July 14. The ETF is the sixth in Global X’s SuperDividend ETF series and is designed to closely track the INDXX SuperDividend Alternatives Index. The underlying index tracks the performance of the highest dividend-yielding securities in each category of alternative income investments, as defined by index sponsor INDXX. This includes MLPs (master limited partnerships), REITs (real estate investment trusts), BDCs (business development companies), and other nontraditional income-producing investments. The Global X SuperDividend Alternatives ETF’s aim is to provide income from alternative sources with low correlation to dividend stocks and other traditional income investments. The strategy also seeks to limit volatility by screening for lower-volatility investments and overweighting categories that have been less volatile, historically. “The alternatives space encompasses a broad range of investments with risks, returns and correlations that differ from traditional equity and fixed income securities,” said Jay Jacobs, research analyst at Global X Funds, in a recent statement. “Investors are increasingly looking for alternative solutions that can potentially generate high income while diversifying their portfolios. Applying the SuperDividend approach to the alternative income space is a natural extension of our suite.” In practice, the Global X SuperDividend Alternatives ETF carries exposure to MLPs and other infrastructure companies, REITs and other real estate investments, alternative managed portfolios, and fixed-income and derivative strategies. As of July 13, REITs accounted for the largest share of the fund’s holdings at over 26%, while private equity and BDCs accounted for the next-largest share at over 19%. MLPs constituted less than 9% of the fund’s holdings, according to the fund’s fact sheet . On the downside, the Global X SuperDividend Alternatives ETF’s expense ratio is rather high at 3.03%. This is largely a function of the fact that the fund invests in other funds, according to ETF.com , and, as required, includes the underlying expense ratios of those fund in its expense ratio.

Bullish Banking Earnings Drive Up These ETFs

The financial sector, which accounts for around one-fifth of the S&P 500 index and started off 2015 as an average performer, has set an upbeat tone this earnings season. Several factors including fewer litigation charges, effective cost control measures and modest improvement in core businesses has given Q2 earnings a boost and sent shares to the positive territory. The Zacks Earnings Trend also bears evidence to this burgeoning trend especially on the earnings front. Total earnings for 41.1% of the sector’s total market capitalization (reported so far) are up 11.7% on flattish revenues (down 0.1%) with beat ratios of 68.8% and 50%, respectively. The performance bettered what we saw from this group of Finance sector companies in other recent quarters. Overall, higher investment banking activity thanks to solid deals in the U.S. ranging from mergers and acquisitions to IPOs along with loan growth, sound trading business and cost containment efforts seem to be holding the key to the recent success. Let’s take a look at the big banks’ earnings which released early this week and in the last: Big Bank Earnings in Focus JPMorgan (NYSE: JPM ) reported earnings of $1.54 per share beating the Zacks Consensus Estimate of $1.44 and improving from the year-ago earnings of $1.46. JPMorgan recorded revenues of $24.5 billion, which was marginally ahead the Zacks Consensus Estimate of $24.4 billion. However, the top line compared unfavorably with the year-ago number of $25.3 billion. Wells Fargo (NYSE: WFC ) earned $1.03/share in Q2 which missed the Zacks Consensus Estimate by a penny. However, the reported figure was above the year-ago number $1.01/share. The quarter’s total revenue came in at $21.3 billion, falling short of the Zacks Consensus Estimate of $21.6 billion. But, revenues rose 1% year over year. Goldman (NYSE: GS ) earned $4.75 per share in Q2 (excluding provisions), beating the Zacks Consensus Estimate of $3.70. Net revenue declined 1% year over year to $9.1 billion but surpassed the Zacks Consensus Estimate of $8.8 billion. Morgan Stanley’s (NYSE: MS ) second-quarter adjusted earnings from continuing operations of 79 cents per share surpassed the Zacks Consensus Estimate of 73 cents but fell from the year-ago number of 89 cents. Net revenue (excluding DVA adjustments) surged 12% year over year to $9.6 billion. Moreover, it came ahead of the Zacks Consensus Estimate of $8.97 billion. Citigroup Inc.’s (NYSE: C ) adjusted earnings per share of $1.45 for the quarter outpaced the Zacks Consensus Estimate of $1.35. Further, earnings compared favorably with the year-ago figure of $1.24. Adjusted revenues of Citigroup declined 2% year over year to $19.16 billion. Including credit valuation adjustment (CVA) and debt valuation adjustment (DVA), Citigroup revenues remained relatively stable with the prior-year period at $19.47 billion. However, the revenue figure surpassed the Zacks Consensus Estimate of $19.16 billion. The true star was Bank of America Corporation (NYSE: BAC ) which turned around this season. Its second-quarter earnings of 45 cents per share outdid the Zacks Consensus Estimate of 36 cents and were way above 19 cents gains earned in the prior-year quarter. Net revenue of $22.1 billion was up 2% year over year and beat the Zacks Consensus Estimate of $21.3 billion. ETF Impact Thanks to a spate of pretty decent earnings from banks last week, the related ETFs got a boost. All the aforementioned companies have considerable exposure in funds like iShares U.S. Financial Services ETF (NYSEARCA: IYG ), iShares US Financials ETF (NYSEARCA: IYF ), PowerShares KBW Bank ETF (NYSEARCA: KBWB ), Financial Select Sector SPDR (NYSEARCA: XLF ) and Vanguard Financials ETF (NYSEARCA: VFH ). All these U.S. financial ETFs were in green and returned in the range of 1.1% to 3% in the last five trading sessions (as of July 20, 2015). Sluggish revenues were a drag on the banking earnings scorecard this season thanks to a still-low interest rate environment, which is however likely to tail off sometime later in 2015 as the Fed is preparing for an interest rate lift-off. Original Post

Dividend Growth Stock Overview: SJW Corporation

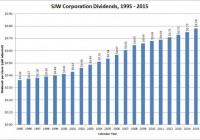
About SJW Corporation SJW Corporation (NYSE: SJW ) provides water services to customers in the San Jose, CA metropolitan area and to customers in the region between San Antonio and Austin, TX. The company was incorporated in California in February 1985, and is headquartered in San Jose. SJW has 395 full-time employees. The company is organized into four subsidiaries: (1) the San Jose Water Company; (2) SJWTX, Inc.; (3) SJW Land Company; and (4) the Texas Water Alliance. SJW Corporation does not report financial information for each of the subsidiaries separately. Originally incorporated in 1866, San Jose Water Company is the predecessor organization to SJW Corporation. In the 1985 reorganization, San Jose Water Company became a wholly-owned subsidiary of SJW Corporation. San Jose Water is a public utility that provides water service to over 1 million people in the metropolitan San Jose area. The company’s supply comes from a variety of sources, including groundwater, surface water, reclaimed water and imported water. Roughly 40-50% of its annual water production is purchased. SJWTX was incorporated in Texas in 1985, and does business as Canyon Lake Water Service Company. This subsidiary provides water service to roughly 36,000 people located in the region between San Antonio and Austin, TX. SJW Land Company owns undeveloped land in California and Tennessee, owns and operates commercial buildings in California, Arizona and Tennessee, and has a 70% interest in a real estate limited partnership. Finally, the Texas Water Alliance subsidiary is developing a water supply project in Texas to ensure future water supplies for the Canyon Lake Water Service Company. As a regulated utility, local and state authorities dictate SJW’s revenues and income. In 2014, the company had operating revenue of $320 million, which was up 15.5% from 2013. Net income more than doubled from 2013 to $51.8 million. Earnings per share did the same, coming in at $2.54, which gives the company a payout ratio of about 31% using the current annualized dividend of 78 cents per share. The revenue and income increase was due to approved rate changes, slightly offset by a reduction in customer water usage. The revenue increase continued in the 1st quarter of the year, with a 13.7% increase in revenue and a more than quadrupling of net income for the quarter year-over-year. In addition to the rate increases, the significant increase in net income was also due to a reduction of groundwater extraction costs. As a company that predominantly operates public utilities, SJW has had, and expects to have, large capital improvement expenditures. The company spent nearly $92 million on capital expenditures in 2014. In 2015, it plans to spend over $133 million as part of more than $660 million in capital improvements from 2015 to 2019. The company is a member of the Russell 2000 index and trades under the ticker symbol SJW. As of mid-July, the stock yielded 2.5%. SJW Corporation’s Dividend and Stock Split History (click to enlarge) SJW has grown dividends at less than 4% a year since 1995. SJW Corporation and its predecessor companies have paid dividends since 1944, and increased them since 1968. It announces annual dividend increases at the end of January, with the stock going ex-dividend in the first half of February. In January 2015, SJW announced a 4% dividend increase to an annualized rate of 78 cents per share. The company should announce its 49th consecutive annual dividend increase in January 2016. SJW Corp. historically increases its dividend in the low- to mid-single digit percentages, and the dividend growth rates reflect this. The company’s 5-year compounded annual dividend growth rate (CADGR) is 2.78%. Longer term, the CADGRs are slightly higher: the 10-year CADGR is 3.81%, the 20-year CADGR is 3.94% and the 25-year CADGR is 3.76%. SJW has split its stock twice. The splits occurred in close succession, with the company splitting the stock 3-for-1 in March 2004 and then 2-for-1 in March 2006. A single share purchased prior to March 2004 would have split into 6 shares. Over the 5 years ending December 31, 2014, SJW Corporation stock appreciated at an annualized rate of 10.40%, from a split-adjusted $19.35 to $31.73. This underperformed the 13.0% compounded return of the S&P 500 index and the 14.0% compounded return of the Russell 2000 Small Cap index over the same period. SJW Corporation’s Direct Purchase and Dividend Reinvestment Plans SJW does not have a direct purchase or dividend reinvestment plan. (The company initiated one for investors in 2011, but terminated it in 2014.) In order to invest in the stock, you’ll need to purchase it through a broker; most will allow you to reinvest dividends without any fee. Ask your broker for more information on how to set this up, if you are interested. Helpful Links SJW Corporation’s Investor Relations Website Current quote and financial summary for SJW Corporation (finviz.com) Disclosure: I do not currently have, nor do I plan to take positions in SJW.