Tag Archives: trackuseraction

Saving Greece? What ETF Investors Should Really Be Focused On

February has been a terrible month for the U.S. economy, but a wonderful month for U.S. stocks. Perhaps ironically, even as an institutional investor, I am not finding myself particularly bearish. On the contrary. I see opportunity to continue riding severely overvalued market-based securities higher. February has been a terrible month for the U.S. economy, but a wonderful month for U.S. stocks. Translation? Investors do not believe that the Federal Reserve will raise overnight lending rates during an economic slowdown. Just how abysmal have the data been so far? Personal spending, construction spending, factory orders, international trade, business inventories, wholesale inventories, consumer sentiment, retail sales and housing starts are just a few of the data points that fell short of expectations. Heck, the Citi Economic Surprise Index recently demonstrated that data points have missed analyst forecasts by the most in more than two years. Most blame the weakening U.S. situation on decelerating activity around the globe. Goldman Sachs has gone so far as to say that the global economy has entered a contraction phase, with six of its seven Global Leading Indicator (GLI) components worsening in February. The lone holdout? U.S. Initial Jobless Claims. Indeed, a low level of unemployment filings coupled with a consistent string of 200,000-plus net new jobs are the positives on the domestic scene. Yet even here, the employment rate as defined by labor force participation is under 63% – percentages that are typically associated with the 1970s. If millions upon millions of working-aged individuals did not give up the search for employment or “retire” since 1/1/2009, back when 66% of working-aged people had jobs, headline unemployment in the U.S. would be above 10.0%. (Naturally, 5.7% unemployment sounds better for those who want to believe that circumstances are much rosier than they really are.) Without question, the U.S. is not an island of self-sustaining expansion. As much as the media portray oil price declines as a windfall for stateside consumers, the slump across the entire commodity space (e.g., metals, agriculture, gas, etc.) communicates anemic demand. Equally troubling, none of the spectacular job gains have translated into significant wage growth in a way that price pressures might rise. (For what it is worth, Wal-Mart (NYSE: WMT ) did raise its wages above Federally mandated minimums for all of its low-earning employees.) Worse yet, depreciating currencies against the U.S. dollar have adversely affected the trade balance such that the Fed acknowledged the dollar’s rapid rise as a “persistent source of restraint” on exports. The Fed is not the only group that has expressed concern about dollar strength. Corporations have blamed the dollar for missing earnings targets, as well as used the currency to guide future earnings projections lower. And analysts have dramatically scaled back profit-per-share outlooks for the S&P 500 from nearly 8%-10% in November to 0%-2% here in February. What do lower earnings projections mean? In essence, the Forward 12-month P/E was the last remaining valuation technique that supported the reasonableness of the current price people are paying for the S&P 500. Not anymore. Cyclical, trailing 12-month and forward 12-month price-to earnings (P/E), price-to-sales (P/S), price-to-book (P/B) and price-to-cash flow (P/CF) all suggest S&P 500 overvaluation. In spite of the seemingly obvious concerns investors should have about U.S. equities, bearish sentiment in the American Association of Individual Investors (AAII) is at a meager 17.88%. According to Bespoke Research, there have been only five weeks of the last 300 where bearish sentiment was lower. Perhaps ironically, even as an institutional investor, I am not finding myself particularly bearish. On the contrary. I see opportunity to continue riding severely overvalued market-based securities higher; that is, there’s no reason to exit the central bank stimulus bubble when the world’s investors have so much faith in their policies. Overvaluation can beget irrational exuberance, and irrational exuberance can beget insane euphoria. It can go on for weeks, months or years. The only caveat? You have to realize the reality that asset prices have gone rogue, and that you will need an insurance plan for reducing risk when the inevitable blow-up transpires. My approach is threefold. First, hold the stock assets that continue to trend higher. Each needs to remain above a a significant trendline like a 200-day moving average; a downside breach should not last more than a couple of days. Some of my favorites? The Vanguard Dividend Appreciation ETF (NYSEARCA: VIG ), the Vanguard Mega Cap Growth ETF (NYSEARCA: MGK ), the Health Care Select Sect SPDR ETF (NYSEARCA: XLV ) and the Vanguard Information Technology ETF (NYSEARCA: VGT ). Additionally, add exposure to assets where you see value, as I have with the iShares Currency Hedged MSCI Germany ETF (NYSEARCA: HEWG ), or add exposure to where you’ve witnessed momentum, as I have with the PureFunds ISE Cyber Security ETF (NYSEARCA: HACK ). Second, recognize that the appeal of long-term U.S. bonds will not dissipate in a weakening global economy. Fits and starts? Sure. Yet long-term U.S treasury proxies yield more than comparable sovereign debt abroad. Buying the bond dips can be as lucrative as buying stocks when they pull back. What’s more, funds like the iShares 20+ Year Treasury Bond ETF (NYSEARCA: TLT ) and the Vanguard Long-Term Bond ETF (NYSEARCA: BLV ) have made more money over the last 15 months than ETFs like the SPDR S&P 500 Trust ETF (NYSEARCA: SPY ) or the Vanguard Total Stock Market ETF (NYSEARCA: VTI ). (Note: Readers know that I have been advocating exposure to longer-term maturities since December of 2013.) Third, there are a wide variety of things that could derail the respective rallies in stocks and bonds. Policy mistakes by one or more of the major central banks around the globe could cause an exodus. A monumental shift toward global acceleration in the worldwide economy would likely catch investors off guard. A decline in oil prices below the current line in the sand at $45 per barrel could cause hardship and/or civil unrest in export-dependent countries. A less-than-graceful exit from the eurozone by Greece (at some point in 2014) could affect the investing landscape. Even an unforeseen event(s) could take market-based securities for a ride where the price declines lead to bearish panic rather than bullish dip-buying opportunity. Disclosure: Gary Gordon, MS, CFP is the president of Pacific Park Financial, Inc., a Registered Investment Adviser with the SEC. Gary Gordon, Pacific Park Financial, Inc, and/or its clients may hold positions in the ETFs, mutual funds, and/or any investment asset mentioned above. The commentary does not constitute individualized investment advice. The opinions offered herein are not personalized recommendations to buy, sell or hold securities. At times, issuers of exchange-traded products compensate Pacific Park Financial, Inc. or its subsidiaries for advertising at the ETF Expert web site. ETF Expert content is created independently of any advertising relationships.
Inside Guggenheim’s New High Income Infrastructure ETF

The income ETF space remains a favorite among investors as evidenced by the incredible level of interest seen in many of the products in the space. In fact, many issuers have lined up with several new funds focused on income strategies to tap into this sentiment (read: 3 ETFs Yielding Over 6% to Watch as Market Speculates Rising Rates ). This trend continues with Guggenheim which has just launched a fund with global coverage, focusing on the high income space, but with a slight tilt as the fund has a specific sector exposure i.e. infrastructure. In fact, the global footprint made the fund more attractive given the ultra-low interest rate backdrop prevailing in most developed economies. Below, we have highlighted the newly launched fund – Guggenheim S&P High Income Infrastructure ETF ( GHII ) – in greater detail. GHII in Focus This product tracks the S&P High Income Infrastructure Index, focusing on 50 high-yielding global infrastructure companies. These companies are engaged in several infrastructure-related sub-industries, such as energy, transportation and utilities. The individual stocks are moderately diversified as no single security forms more than 5.09% of the total fund assets. Sydney Airport (5.09%), Williams Companies, Inc. (4.99%) and Jiangsu Express Co. Ltd-H (4.79%) are the top three holdings of the fund. As far as geographic allocation is concerned, the U.S. takes the top spot with about one fifth of the basket followed by Australia (14.45%) and China (9.37%). Overall, the fund is spread across 15 countries. Utilities hold the lion’s share followed by Industrials (33.15%) and Energy (16.70%). The fund charges 45 bps in fee. How Could it Fit in a Portfolio? The ETF could be well suited for income-oriented investors seeking higher longer-term returns with low risk. Utilities and infrastructure related stocks are interest rate sensitive and recession resistant in nature. With interest rates being low in most developed nations, the appeal of utilities stocks has increased as these offer steady and strong yields (read: 3 Utility ETFs Surging to Start 2015 ). However, investors looking for a high-growth vehicle may not be satisfied with this product as infrastructure is generally a slow-growth business. Competition The main competitor of GHII is the established iShares S&P Global Infrastructure Index Fund ( IGF ) . This product also focuses in on global utilities ranging from transportation to electricity services, and it has already seen a great deal of interest from investors, as evidenced by its $1.18 billion in assets under management. This iShares fund charges 47 bps in fee. The U.S. takes about 32.8% of the basket followed by Canada (8.33%) and Australia (8.17%). The fund holds 75 stocks in total. The fund yields yielded about 2.98% as of February 19, 2015. The newly launched ETF will also face stiff competition from iShares S&P Global Utilities Index Fund ( JXI ) , which has amassed about $338.3 million in assets. The fund charges 48 bps in fees and yields about 3.67% annually (as of February 19, 2015) (read: FlexShares Launches Global Infrastructure ETF ). Another potentially sound player in the space is SPDR FTSE/Macquarie Global Infrastructure 100 ETF ( GII ) though the fund was behind the newly launched GHII in terms of assets within such a short span. Notably, within just seven days of launch, GHII has amassed about $189 million in assets while GII has garnered $112 million in AUM. So, though competition may be intensifying in the global infrastructure ETF world, GHII is definitely worth a closer look. The product charges reasonably in the space and has an attractive yield, which is drawing investors’ attention. We expect its winning trend to continue in the days to come. Also, most other global infrastructure ETFs have put a large weight on the U.S. unlike GHII. A lower focus on the U.S. market might earn GHII an extra advantage over its peers as the U.S. economy will likely see a rise in rates.

Weathering Market Volatility With Smart Beta

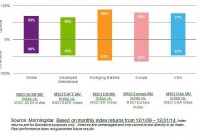
In my post on smart beta predictions for the year , I suggested that a minimum volatility (min vol) strategy would be top of mind for investors. It hasn’t taken long for that trend to materialize, as this segment posted strong returns and enjoyed inflows of $1.9 billion in the first month of 2015 (Source: Bloomberg; BlackRock ETP Landscape Report). In today’s market climate – where volatility has moved from historical lows to above long-term averages in just a few short months – the case for min vol is particularly timely. A strategy for market ups and downs Like all smart beta strategies, min vol blends aspects of traditional active and passive investing: active in that the strategies attempt to improve risk-adjusted return; passive in that portfolio construction is generally objective and based on pre-set rules. The chart below illustrates this asymmetrical behavior: for example, over the last five years, the MSCI US Minimum Volatility Index has experienced only 47% of the downside return of the standard MSCI USA Index, but captured 77% of the upside. This potential for downside protection and upside participation is how min vol portfolios have delivered strong risk adjusted returns over the long term, with smaller bumps in the road. Upside Vs. Downside Capture for MSCI Minimum Volatility Indices I like to think of min vol as being similar to windbreaker. It can help provide some protection against the sun without being too hot. And when it rains, you have something to help keep you dry. It’s an item you keep with you all year to help guard against different kinds of weather. Weathering the storm My colleague Russ Koesterich points out that volatility is back, and likely here to stay awhile . That’s a change from last year: The VIX fell well below its long-term average of 13.6 in the first half of the year before spiking above 25 in October and has remained elevated since (Source: Thomson Reuters, BlackRock Investment Institute). Against that backdrop, the MSCI U.S. Minimum Volatility Index slightly lagged the S&P 500 for the first three quarters of the year before roaring ahead to end 2015 at 16.5%, compared to the S&P’s 13.7%. But if you take away any stats from this story, here’s the most important one: The MSCI U.S. Minimum Volatility Index was 34% less volatile than the S&P 500 over that same one-year period. Min vol strategies have historically performed well in volatile times. The chart below plots the VIX Index in red – a commonly used metric of market volatility. The blue bars represent the monthly performance difference between the MSCI USA Minimum Volatility Index and the S&P 500 Index. Historically the min vol index has generally out-performed the S&P 500 in months when volatility was rising. What about when volatility abates? By limiting the downside during the deepest troughs, the min vol index was better able to capitalize on a rebound. . . In today’s more turbulent market environment, the lower volatility sought by min vol strategies is particularly appealing to many investors. In January alone, the S&P 500 has experienced a daily change of over 1% in 8 out of 20 trading days, or 40% of the time. As my colleague Nelli Oster explores in her posts on investor behavior, it can be difficult to tune out that degree of volatility and stay focused on your long-term investment goals: paying for college, saving for retirement or planning to expand your family. Where we go from here Volatility is born from uncertainty: the heightened level of risk we see in capital markets is driven by the divergence across today’s global economy. The catalysts for that divergence – conflicting central bank actions, disparate levels of economic growth across the globe and a long list of geopolitical risks – are unlikely to dissipate any time soon. This means that market volatility will likely remain elevated. I like minimum volatility for the long haul. It’s a way to participate in equity markets with the potential for less volatility and allows you to stay focused on your investment goals even in turbulent times. As market bumps are a daily reality, min vol may be an appealing investment solution, and can help keep both you and your investment strategy on track. Original Post