Tag Archives: top-ten

Today’s Strong Competitive Wealth-Builder ETF Investment

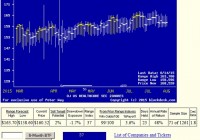
Summary From a population of some 350 actively-traded, substantial, and growing ETFs this is a currently attractive addition to a portfolio whose principal objective is wealth accumulation by active investing. We daily evaluate future near-term price gain prospects for quality, market-seasoned ETFs, based on the expectations of market-makers [MMs], drawing on their insights from client order-flows. The analysis of our subject ETF’s price prospects is reinforced by parallel MM forecasts for each of the ETF’s ten largest holdings. Qualitative appraisals of the forecasts are derived from how well the MMs have foreseen subsequent price behaviors following prior forecasts similar to today’s. Size of prospective gains, odds of winning transactions, worst-case price drawdowns, and marketability measures are all taken into account. Today’s most attractive ETF Is the iShares U.S. Healthcare ETF (NYSEARCA: IYH ) . The investment seeks to track the investment results of an index composed of U.S. equities in the healthcare sector. The fund generally invests at least 90% of its assets in securities of the underlying index and in depositary receipts representing securities of the underlying index. It seeks to track the investment results of the Dow Jones U.S. Health Care Index (the “underlying index”), which measures the performance of the healthcare sector of the U.S. equity market. The fund is non-diversified. (Description from Yahoo Finance.) The fund currently holds assets of $2.68 billion and has had a YTD price return of +13.73%. Its average daily trading volume of 261,855 produces a complete asset turnover calculation in 64 days at its current price of $161.94. Behavioral analysis of market-maker hedging actions while providing market liquidity for volume block trades in the ETF by interested major investment funds has produced the recent past (6 month) daily history of implied price range forecasts pictured in Figure 1. Figure 1 (used with permission) The vertical lines of Figure 1 are a visual history of forward-looking expectations of coming prices for the subject ETF. They are NOT a backward-in-time look at actual daily price ranges, but the heavy dot in each range is the ending market quote of the day the forecast was made. What is important in the picture is the balance of upside prospects in comparison to downside concerns. That ratio is expressed in the Forecast Range Index [RI], whose number tells what percentage of the whole range lies below the then current price. Today’s Range Index is used to evaluate how well prior forecasts of similar RIs for this ETF have previously worked out. The size of that historic sample is given near the right-hand end of the data line below the picture. The current RI’s size in relation to all available RIs of the past 5 years is indicated in the small blue thumbnail distribution at the bottom of Figure 1. The first items in the data line are current information: The current high and low of the forecast range, and the percent change from the market quote to the top of the range, as a sell target. The Range Index is of the current forecast. Other items of data are all derived from the history of prior forecasts. They stem from applying a T ime- E fficient R isk M anagement D iscipline to hypothetical holdings initiated by the MM forecasts. That discipline requires a next-day closing price cost position be held no longer than 63 market days (3 months) unless first encountered by a market close equal to or above the sell target. The net payoffs are the cumulative average simple percent gains of all such forecast positions, including losses. Days held are average market rather than calendar days held in the sample positions. Drawdown exposure indicates the typical worst-case price experience during those holding periods. Win odds tells what percentage proportion of the sample recovered from the drawdowns to produce a gain. The cred(ibility) ratio compares the sell target prospect with the historic net payoff experiences. Figure 2 provides a longer-time perspective by drawing a once-a week look from the Figure 1 source forecasts, back over two years. Figure 2 (used with permission) What does this ETF hold, causing such price expectations? Figure 3 is a table of securities held by the subject ETF, indicating its concentration in the top ten largest holdings, and their percentage of the ETF’s total value. Figure 3 source: Yahoo Finance IYH has over half its investments in ten major, mainstream corporations serving the broad healthcare industry, from pharmaceuticals producers to healthcare insurers, medical equipment makers, and service providers. Investments in developmental research in biotechnology are restricted to the in-house activities of the big-pharma companies held. There the emphasis is more likely to be on capitalizing on known technology and existing markets rather than on breakthrough developmental activities. The expectations for these companies, derived from Market-Maker hedging to protect its own capital while facilitating volume transactions for big-$ fund clients, is shown below. Figure 4 is a table of data lines similar to that contained in Figure 1, for each of the top ten holdings of IYH. Figure 4 (click to enlarge) In an industry as unpredictably dynamic as this, wide variations in market experience can be the rule. The averages of IYH’s 10 largest holdings compete quite favorably with the 20 best equity wealth-building candidates from our population of 2475 issues. Column (5) contains the upside price change forecasts between current market prices and the upper limit of prices regarded by MMs as being worth paying for price change protection. The average of +9.0% of the top ten IYH holdings is close to the +10.2% of the population’s best. Its investments in Gilead Sciences, Inc. ( GILD) and AbbVie Inc. ( ABBV) exploit the hep-c extensive market, which has produced impressive stock price gains (11). BMY at its present price and coming price expectations offers further support for IYH gains. The other side of the coin is column (6), which shows what actual worst-case price drawdowns have been typical in the 3 months following each time there has been a forecast like those of the present day. Those risk exposures have been only -4.0% in the holdings top ten, less than half the -8.6% by equities at large. The IYH 10’s reward-to-risk ratio (14) of 2.3 outranks all of the other aggregate set measures. Conclusion IYH provides only modestly attractive forecast price gains, supported by equally appealing largest holdings. Both the ETF and many of its major holdings offer very attractive prospects in near-term price behaviors, demonstrated by previous experiences following prior similar forecasts by market makers. The principal attraction of IYF at this point in time is its strength of resistance to price drawdowns and excellent recovery from temporary bad times by the strong underlying trend of its economic sector. In any period of concern over market weakness this is a prime defensive commitment here. Disclosure: I/we have no positions in any stocks mentioned, and no plans to initiate any positions within the next 72 hours. (More…) I wrote this article myself, and it expresses my own opinions. I am not receiving compensation for it (other than from Seeking Alpha). I have no business relationship with any company whose stock is mentioned in this article.
The Global X MSCI Colombia ETF: Rebound From 52-Week Lows

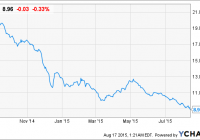
Summary Colombia is projected to have the highest Annual GDP Growth in Latin America in the next 12 months. The Global X MSCI Colombia ETF is trading below its book value and is also trading at its 52 week low. The fund has witnessed a sharp decline in its price since 2014, yet financial performance of the fund’s top 10 holdings during this year was favorable. General exposure to this ETF is a wise endeavor, while specifically investing in the banking industry may be wiser, due to its lower valuation and superior financial performance during 2014. Given the current low oil price environment, Colombia is certainly a country worth investigating for a potential rebound, as the Global X MSCI Colombia ETF (NYSEARCA: GXG ) has witnessed a sharp decline in price since September 2014; the fund reached a high of 20.78 around this time and is now trading at 8.96. Despite the risks associated with its economy being dependent on oil exports, and the fact that it has had the highest political risk among countries in Latin America, there are still ample opportunities to be found after investigating the valuation and current price of this ETF; the fund is trading below its book value and is also trading at its 52 week low. Moreover, Colombia has been among one of the fastest growing countries in Latin America, and has the highest economic growth projections for the next twelve months. GXG data by YCharts Global X MSCI Colombia ETF The fund has been consistently declining since 2014, and is extremely far from its 52 week high of 20.78. The recent decline in the price of oil has attributed to a drop in the fund’s price, and has consequently created attractive valuation : P/E ratio: 15.91 P/B ratio: 0.92 P/S ratio: 1.01 The fund’s holdings are extremely diverse, and invest into the following industries: Financial Services: 36.74% Basic Materials: 16.85% Utilities: 16.46% Industrials: 6.66% Economic Outlook Colombia has a favorable economic outlook for the next twelve months, and will lead Latin America in Annual GDP Growth. The following projections have been made for the 2nd quarter of 2016 Annual GDP Growth will increase from 2.8% to 3.2%. Inflation will remain near 4.4%. Exports will decrease by 3.1%. FDI will increase by 22.9%. Crude oil production will decrease by 0.7%. Retail sales will increase by 4.42%. Consumer spending will increase by 3.2%. Consumer credit will increase by 10.4%. Overall economic projections for the next twelve months appear to be very favorable for the country, with slight Annual GDP growth projected for the next twelve months. An increased trend of consumption and retail sales is projected for the next twelve months, which will further attribute to economic growth. Most important to note, is that the low oil price environment has not deterred FDI, as this is projected to increase by 22.9% during the next 12 months. Latin America Annual GDP Growth Comparison Recently Colombia has had the highest Annual GDP Growth, and is on track for higher economic growth during the next twelve months. While Peru and Chile have ample potential for long term recovery due to the current adverse impact of low commodity prices, a twelve month outlook provides the most favorable results for Colombia. Annual GDP Growth 2012 2013 2014 Current 2nd Quarter 2016 Projections Colombia 4 4.9 4.6 2.8 3.2 Peru 6 5.8 2.4 1.7 2.03 Argentina 0.8 2.9 0.5 1.1 0.76 Chile 5.5 4.2 1.9 2.41 2.37 Brazil 1.8 2.7 0.1 -1.6 -0.3 Source: World Bank Top 10 Holdings Overall, the financial performance of the fund’s top ten holdings has been exceptional, which makes the fund’s sharp drop in price somewhat undeserved. The fund’s holdings had a 10.6% increase in net revenue and a 10.8% increase in net income. An industry specific approach provides a mixed outlook regarding valuation and financial performance: The banking industry can be considered superior, due to its extremely attractive valuation and having exceptional growth. The utilities industry also had exceptional growth, and its valuation is relatively attractive. The consumer products industry has relatively attractive valuation, but experienced negligent growth. Increased projections for consumer spending will be a positive driver for future growth. The construction industry had substantial growth, but also has extremely high valuation. For risk seeking investors, the main holding in the oil industry has low valuation, although financial performance was not favorable in 2014. Value Based Approach Ecopetrol S.A and Bancolombia SA are two options for valued based investors to gain exposure to Colombia, as both companies have lower valuation than the ETF. Bancolombia SA’s historical P/E has been exceptionally higher in the past, with a five year P/E high of 38.61 . The banking industry holdings in the fund were among the top performing, and Bancolombia SA is a superior pick considering its net income increased by 24% while the fund’s price dropped substantially. Ecopetrol SA is a riskier pick as its net income and net revenue have been consistently declining since 2012, and sole exposure to this industry may be risky. However, valuation is the lowest of the fund’s top 10 holdings. Conclusion Now is an strategic moment for investors to gain access to Colombia’s growth, which is set to outpace other countries in Latin America during the next twelve months. The low oil price environment has created attractive valuation for the Global X MSCI Colombia ETF, which is further edified by the projected growth for Colombia. General exposure to this ETF is a wise endeavor, while specifically investing in the banking industry may be wiser, due to its lower valuation and superior financial performance during 2014. Disclosure: I/we have no positions in any stocks mentioned, and no plans to initiate any positions within the next 72 hours. (More…) I wrote this article myself, and it expresses my own opinions. I am not receiving compensation for it (other than from Seeking Alpha). I have no business relationship with any company whose stock is mentioned in this article.
Invest In Africa’s Growth Through The Market Vectors Africa Index ETF

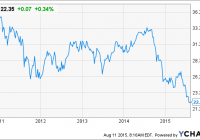
Summary The Market Vectors Africa ETF provides diverse exposure to Africa’s growth, and strategically invests over 40% of its assets in the banking industry. Earnings for 9 out of 10 of the fund’s top ten holdings increased, as the fund’s price sharply dropped in 2014. The Global X MSCI Nigeria ETF is extremely undervalued at the moment, and presents a unique buy opportunity for those willing to risk investing in a low oil price environment. The Market Vectors Africa Index ETF (NYSEARCA: AFK ) is the simplest and most efficient solution for investors to gain exposure to Africa’s economic growth. The fund has experienced a sharp drop in price since 2014, which is not at all correlated to the financial earnings of the fund’s major holdings. This has created substantially low valuation for the fund. Moreover, the economic outlook for Africa is favorable, with overall projected growth in the country’s that the fund invests into. Demographics in this region are also favorable, as the population is growing by more than 2% and 43% of the population is younger than 15. Moreover trends of urbanization are rising, although approximately 70% of the population earns their income from agriculture. That being said, Africa certainly has challenges ahead of it, and this fund is most appropriate for investors who are willing to take a long term horizon, and confidently hold if the fund experiences a further drop in price. Growth projections for this region have been lowered to 4.2%, with a slightly higher forecast for 2016 and 2017; this is due to concerns with the impact of low oil prices on Algeria and Nigeria, and difficulties in electricity supply in South Africa. While fully acknowledging these threats, I still remain bullish on Africa and believe that some options listed on U.S. Exchanges, although there are not many, provide ample opportunities for investors to gain exposure to Africa’s future growth. AFK data by YCharts 12 Month Economic Outlook Overall, the economic outlook for the five main countries that the fund invest into looks favorable. Average annual GDP growth was recently 3.65%, and is projected to increase to 4.1% in the next 12 months, an accurate projection of the projections for Sub Saharan Africa. Consumer Spending is projected to increase by around 3.3% for these countries, with the highest growth being in Morocco and Kenya. Areas of concern include the projected decrease in exports, and the issues previously mentioned with South Africa and Nigeria. Annual GDP Growth Annual GDP Growth Projection in 12 Months 12 Month Consumer Spending Growth Projection 12 Month Export Increase Projection Nigeria 3.96% 5.08% 2.3% -1.4% Egypt 3% 5% -0.4% -10.9% South Africa 2.1% 2.1% -2% 3.3% Morocco 4.3% 2.76% 7.3% -1.8% Kenya 4.9% 5.46% 9.4% -5.4% Top Fund Holdings By examining the fund’s top ten holdings , it is clear to see the sharp drop in fund price was not correlated to the fund’s financial performance, and has created an excellent buy opportunity. While the fund’s price dropped substantially in 2014, all companies, except for Nigeria Breweries PLC, were able to increase in net income. Banking industry The baking industry in Africa has a very favorable outlook and substantial growth ahead, which is another positive driver for this fund, which invests around 40% of its assets in this industry. Financial performance of the fund’s holdings was excellent, with the five companies having an average of 14.8% increase in net income during 2014. The widespread introduction of mobile banking throughout Africa has been a huge catalyst for the industry’s growth, and the high unbanked population in Africa provides room for further growth in this industry. The holdings in the banking industry in this fund have extremely attractive valuation, and represent a positive compliment to the high valuation of Nigeria’s consumer product industry. Unfortunately none of these companies are listed on U.S. exchanges, but can be considered a positive driver for the fund Nigeria Focus While the negative impact of Boko Haram and low oil prices should certainly be considered negative drivers for Nigeria, the country has key strengths in multiple industries that offsets this risk. The rise of the consumer products industry and banking industry in Nigeria, coupled with massive infrastructural developments, have resulted in an economy that is more diversified and less vulnerable to oil prices. While Its export earnings are highly dependent on the price oil, the country’s GDP is extremely diversified, with oil only attributing to 14% of the country’s GDP. The consumer products industry is on the rise, although valuation is a concern, and the banking industry also displays ample potential. Oscar Onyeama, CEO of Nigerian Stock Exchange, made the following statement about the declining price of oil’s impact on Nigeria’s economy: The effects of the declining oil prices can be felt in nearly all areas of our national life; from the pressure on the naira, which has led to the central bank of Nigeria’s spending over $4.7 billion to defend the national currency, through the impact on the capital markets with foreign investors taking a wait and see attitude in the last couple of months, to federal government budget deficits. While the decrease in oil prices has certainly put a strain on Nigeria’s economy, there is certainly growth and attractive valuation to be found in other industries. The Global X MSCI Nigeria ETF (NYSEARCA: NGE ) is an excellent way to gain exposure to Nigeria, has a wide variety of industries developing outside of the oil industry. Its current valuation is among the lowest of ETFs in Asia and Africa, and has substantial growth ahead of it. Investors who are willing to take the risks associated with geopolitics and the country’s dependency on oil prices, will be rewarded with the fund’s low valuation and high growth potential. While general exposure to Africa, through AFK, is the most conservative endeavor for investors, specifically identifying opportunities in Nigeria provides the opportunity for higher returns, by taking advantage of the fund’s current low valuation; it currently has a P/E of 9. Conclusion The Market Vectors Africa Index ETF is an excellent means for investors to gain exposure to Africa, due to its diversified holdings and low valuation. Investors who prefer a higher risk and less diversified investment approach, should strongly consider the Global X MSCI Nigeria ETF. Both funds have received an undeserved drop in price, and present an excellent buy opportunity for investors with a long term vision for Africa’s growth. Disclosure: I/we have no positions in any stocks mentioned, and no plans to initiate any positions within the next 72 hours. (More…) I wrote this article myself, and it expresses my own opinions. I am not receiving compensation for it (other than from Seeking Alpha). I have no business relationship with any company whose stock is mentioned in this article.