Tag Archives: top-ideas

Do Your Alternative Investments Have The Right Fit?

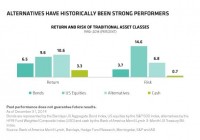
By Richard Brink, Christine Johnson Investors who chose alternatives for downside protection in recent years have been frustrated with their performance. We think the problems were an unfavorable market environment and the unique challenges of manager selection for alternatives. In May 2013, the market’s “taper tantrum” in reaction to announced changes in U.S. monetary policy pushed bond yields up; stocks stumbled briefly before continuing to pile up strong returns. For many investors, this heightened concerns about extended market valuations and an impending interest-rate increase. Taking a page from the typical playbook, many investors looked toward long/short equity strategies and nontraditional bonds as ways to protect against potential market downside. But in 2014, playing defense didn’t pay off: U.S. equity markets gained another 14% and bond yields fell. Long/short equity strategies, on average, returned 4%. That experience left many investors disappointed with alternatives-both equity-oriented and fixed income-oriented. It hardly came as a surprise when investors shifted money out of alternatives early in 2015, moving it into core fixed-income funds and international equities-mostly through passive exchange-traded funds (ETFs). The Long-Term Value of Alternatives We think investors were right in looking to alternatives for protection against potential downturns. Alternatives have provided better returns than stocks, bonds or cash over the past 25 or so years, with less than half the volatility of stocks ( Display ). And long-term data show that incorporating alternatives in a traditional portfolio may enhance returns and reduce risk. If that’s the case, what went wrong in 2014? We think the problem was twofold. First, a good portion of alternatives’ poor performance stemmed from the multiyear, largely uninterrupted bull-market run. This extended rally rendered the long-term benefit of “hedging” with alternatives somewhat moot. Second, many investors bought the right idea of alternatives: participation in all markets with downside protection. But in many cases, they didn’t buy the specific behavior in an alternative that was the best fit for their portfolio and risk/return preferences. It’s not an easy selection process. There are thousands of different alternative strategies to choose from and a lot of dispersion among managers within alternative categories. It’s not enough to simply buy a top performer from a seemingly relevant category. It’s critical to have specific characteristics in mind: Exactly how much downside protection do you want? And how much participation in up markets are you looking for? Once you know your objectives, you can start doing the homework to zero in on a strategy and manager that aligns with them. What’s in an Alternative Category? Everything One of the challenges to finding the right fit is that alternative categories have a lot more variety than their traditional equivalents. They just don’t provide as much help in narrowing down the decision. Take Morningstar indices. They have about 40 different categories for traditional, or long-only, equities. There are categories for different geographies, market capitalization ranges, styles and even sectors. For long/short equities, there’s only one category. If an investor wants to find the right long/short equity strategy, it takes a lot of legwork to uncover the one with the best fit. Without that, investors are at the mercy of manager dispersion. Three Levers That Create Manager Dispersion What creates such big dispersion among alternative managers? We think three levers are at play: style, market risk and approach. We talked about the first lever already: the traditional style buckets of geography, investment approach, market capitalization and industry/sector make for a lot of differences. The second lever is how much overall market risk and sensitivity a manager has-a lot or a little-and how much it varies depending on conditions. The third lever is the approach a manager uses to create the portfolio’s overall market exposure. For example, does the manager use cash, market hedges or short positions in individual stocks? What mix of these instruments does the manager use, and in what environments? All three elements and their combinations can vary to define your experience with a specific alternative manager’s approach. Conducting three-dimensional research to gain a clear understanding of the levers-and which settings are best for you-is the key to choosing the right alternative manager. And the need to make that choice is rather pressing today, in our view. There aren’t a lot of broad cheap areas in capital markets today, and we expect more modest returns and higher volatility ahead for both stocks and bonds. Relying on broad market returns alone isn’t likely to be as rewarding in the years to come, and alternatives can play a key role in enhancing a portfolio’s risk/return profile. The views expressed herein do not constitute research, investment advice or trade recommendations and do not necessarily represent the views of all AB portfolio-management teams.
Plan To Survive: Be Systematic!

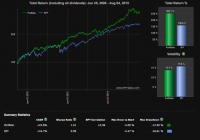
Surviving this environment is tough. Investors need evidence-based methods (EBM). This series will provide some tools. To survive the current investment environment, investors need systematic, evidence-based methods which will skew the odds in their favor. In this series, I will present a variety of strategy indices which my firm has created, which will provide some tools to aid in survival. In a the dog-eat-dog world of the financial markets, solid technology is essential. My firm has created a variety of strategy indices which have pounded the S&P 500, utilized structural forms of alpha creation, and reduced investors’ correlation to the stock market. This year, we will focus on strategies which have a low correlation to both stocks and to bonds. As always, our cutting-edge strategies are only available to subscribers, but I hope that some of the strategy indices presented here will provide inspiration for readers to create their own methods for dealing with an increasingly difficult investment environment. Remember, hope is for people who do not use data. Wise investors plan using evidence-based methods. Please note that even though the rules of this strategy index have been publicly-released, that like any other index, we require the execution of a licensing agreement with ZOMMA LLC for any form of commercial use whatsoever. ZOMMA Quant Warthog II Rules: I. Buy UPRO (NYSEARCA: UPRO ) with 30% of the dollar value of the portfolio. II. Buy TMF (NYSEARCA: TMF ) with 20% of the dollar value of the portfolio III. Buy EUO (NYSEARCA: EUO ) with 40% of the dollar value of the portfolio. IV. Buy UGL (NYSEARCA: UGL ) with 10% of the dollar value of the portfolio. V. Rebalance annually to maintain the 30%/20%/40%/10% dollar value split between the instruments. Here are the results of a backtest of these rules in a log scale: (click to enlarge) (click to enlarge) What is the intuition behind this market-thumping performance? UPRO is a 3X leveraged S&P 500 ETF. TMF is a 3X leveraged 20+ years government bond fund ETN. EUO is a 2X short Euro ETF, and UGL is a 2X leveraged gold ETF. In a flat to bullish environment for bonds, the often inverse nature of stock / bond correlation is well known. Hence the UPRO/TMF inclusion in the index. In addition, since the leverage in the instruments in non-recourse, the use of UPRO/TMF is far safer than the use of margin leverage. Indeed, UPRO/TMF can only go to zero. However, in a rising interest rate environment, long-dated government bonds often get slammed, but the higher interest rates lead the dollar to strengthen. A 2X short Euro ETF is synthetically long the dollar. When U.S. interest rates rise, since this makes the dollar more attractive, EUO should jump with rising real U.S. interest rates. Therefore, EUO acts as a hedge for TMF. In addition, a synthetic dollar long position can be an excellent hedge in a deflationary environment in which the U.S. dollar strengthens. The UGL allocation is for a potential hyperinflation or monetary debasement scenario in which bonds and the dollar get slammed. The 2X leveraged gold ETF has the ability to help in such a scenario. Remember, UGL can jump dramatically, but because the leverage in UGL is inherent to the instrument and non-recourse, it can only go to zero. Indeed, the leveraged nature of the instruments acts like a call option on various asset classes, without the margin leverage inherent in other paradigms such as Risk Parity. This strategy index is truly impressive. It has 6 percentage points less maximum drawdown than the SPY (NYSEARCA: SPY ), while having 6 percentage points more of CAGR. In addition, it accomplishes this feat with only a 0.36 correlation to SPY. Very impressive. But what is this strategy index’s correlation to long-dated government bonds? Here are the results of a backtest of these rules in a log scale: (click to enlarge) The strategy index is only 0.36 correlated to leveraged long bonds as well. Extremely impressive. And with a Sharpe ratio of 1.51, the strategy is a serious tool in the investor’s toolbox. And this strategy index achieves low correlations to stocks and to fixed income, without strong commodity correlation either. Below is a log scale graph of the strategy index’s backtested rules compared to its UGL 2X leveraged gold component: (click to enlarge) The strategy index has only a 0.29 correlation to UGL. To summarize, the index has a low correlation to stocks, to bonds, and to commodities. Therefore, for investors who wisely fear that bear markets in stocks, in bonds, or in commodities could hurt their portfolios, perhaps they should consider an index which offers the chance of a low correlation to all three asset classes. Remember, hope is for people who do not use data. Wise investors plan using evidence-based methods. Solid evidence-based technology goes a long way. At the very least, this index is a valuable tool for conceptualizing issues of correlation and diversification within an evidence-based framework. Thanks for reading. Hypothetical performance results have many inherent limitations, some of which are described below. No representation is being made that any account will or is likely to achieve profits or losses similar to those shown; in fact, there are frequently sharp differences between hypothetical performance results and the actual results subsequently achieved by any particular trading program. One of the limitations of hypothetical performance results is that they are generally prepared with the benefit of hindsight. In addition, hypothetical trading does not involve financial risk, and no hypothetical trading record can completely account for the impact of financial risk of actual trading. For example, the ability to withstand losses or to adhere to a particular trading program in spite of trading losses are material points which can also adversely affect actual trading results. There are numerous other factors related to the markets in general or to the implementation of any specific trading program which cannot be fully accounted for in the preparation of hypothetical performance results and all which can adversely affect trading results. Disclosure: I/we have no positions in any stocks mentioned, but may initiate a long position in SPXL, TMF, EUO, UGL over the next 72 hours. (More…) I wrote this article myself, and it expresses my own opinions. I am not receiving compensation for it (other than from Seeking Alpha). I have no business relationship with any company whose stock is mentioned in this article.