Tag Archives: strategy

LS Opportunity Fund Changes Sub-Advisor, Objective, Strategy

By DailyAlts Staff There have been a number of changes to the LS Opportunity Fund (MUTF: LSOFX ) over the past several months. On April 23, the fund’s Board of Trustees filed paperwork with the SEC announcing the termination of the fund’s sub-advisory relationship with Independence Capital Asset Partners. According to sources, this change was due to the retirement of Jim Hillary, a portfolio manager on the fund and Chairman, CEO and CIO of Independence Capital Asset Partners. In addition to Mr. Hillary’s retirement, the firm will be returning capital to his hedge fund investors. Following the termination of Independence, the fund appointed Prospector Partners, LLC, a Connecticut based asset manager, as an interim sub-advisor and transitioned the portfolio to Prospector on May 28. Shareholders are being asked to approve Prospector as the sub-advisor, along with additional changes to the fund as outlined below, at the upcoming shareholder’s meeting on September 17. Changes to Fund Objectives and Implementation Now the LS Opportunity Fund is planning changes to its investment objective and strategy, as well as giving its advisor more power to hire and fire sub-advisors. According to a July 15 SEC filing, these changes will not result in higher fees for investors, nor will they alter the long/short equity orientation of the fund’s strategy. There is, however, a moderate change to the implementation of that strategy, which will now allow the fund to combine long positions with shorts of two or more stocks in the same sector, whereas previously, it called for “pair trades” of one long and exactly two shorts. The fund’s investment objective has also been slightly revised, with the new objective “to seek to generate long-term capital appreciation by investing in both long and short positions within a portfolio consisting of primarily publicly-traded common stock, with less net exposure than that of the stock market in general.” Formerly, the word “risk” appeared in place of “net exposure” in the fund’s stated objective. Fund Performance The LS Opportunity Fund, which launched in September 2010, has a three-star rating from Morningstar. For the three-year period ending June 30, the fund returned 7.76%, ranking it in the top 38% of funds in its Morningstar category. More recently, however, the fund’s returns haven’t been as strong: Year-to-date, through June 30, the LS Opportunity Fund’s -3.57% returns ranked in the bottom 13% of long/short equity funds. For more information, view a copy of the fund’s prospectus .
How To Find The Next Great Growth Stock

Now is the time to be paying close attention to the market to find the next group of market leading stocks. Traits that define market leading stocks never change, all past winners have the same traits in common. CAN SLIM Investing and why you need to familiarize yourself with this strategy to discover winning growth stocks. Its a great time to be refreshing your watch list and be closely monitoring the market as volatility tends to bring opportunities. An investor always wants to be in tune with the market no matter how discouraging things may seem. The stocks that hold up the best during market corrections and volatility are the stocks that should be bought when the market gets its footing back. These are the stocks that institutions are refusing to dump even in a difficult environment. These stocks typically all have something in common, they have the “it” factor. The characteristics of great growth stocks never change. The “it” factor is a combination of multiple things. They display exceptional sales and earnings growth, have a new product or service, typically have just gone public within the last eight years or sooner, and are in high demand by institutional investors and come from strong industry groups. These characteristics are the basis of CAN SLIM investing. CAN SLIM is a growth stock investment strategy introduced by William O’neil founder of Investors Business Daily newspaper. O’neil analyzed the top performing stocks dating back to the 1880’s and identified 7 characteristics they all shared. C = Current quarterly earnings and sales growth should be up at least 25% or more for the last two quarters. Accelerating earnings and sales growth for three quarters in a row and you could have a potential big winning stock. A = Annual earnings growth of at least 25% for each of the past 3-5 years. Also look for return on equity (ROE) of at least 17% N = Look for companies with new products, new services, new conditions in their industry, new management, and new price highs. S = Supply and Demand – look for big volume moves in the stock during upside trading. L = Leader – Look for the top stocks both fundamentally and technically, in the best performing sectors and industry groups. I = Institutional sponsorship – Watch what pension funds, mutual funds, banks and other institutions are buying. M = Market Direction – Three out of four stocks follow the market trend, therefore only buy growth stocks when the market is in an uptrend. This time tested and proven strategy is a blend of fundamental and technical analysis. If you can identify companies that fit the “CAN” in the acronym you have taken your first step to discovering the importance of the fundamental side of the equation. Take Palo Alto networks(NYSE: PANW ) for example in May of 2014. The company had just reported its second quarter results showing a 57% increase in Earnings per share and a 49% increase in sales. This fits the “C” part of the equation. The company showed a 84% annual increase in in EPS numbers in 2014 fitting the “A” part of the equation perfectly. At the time of the second quarter earning release the company had posted two quarters of significant earnings growth foreshadowing the strength of projected earnings for the year. Throw in the fact that the company was in a red hot cyber security sector with a new technology to help companies ward of cyber attacks and you then satisfy the “N” part of the equation. You now have the making of a big potential winning stock with strong fundamentals in a red hot industry which is acting like a market leader. The “SLIM” part of the equation covers the technical aspects of growth investing as well as the health of the market. The “S” in the strategy is a whole set of technical analysis skills that must be learned and developed to be able to identify supply and demand. The market repeats symmetrical patterns. Through the use of technical analysis and pattern recognition experience these patterns can be identified for good potential risk reward set ups. Lets go back to Palo Alto Networks( PANW ) in May of 2014. The stock was coming out of a proper technical basing pattern and offered investors a good risk reward entry after it reported earnings. The stock closed at a price of $73.17 on May 29th 2014. The stock was a market leader at the time satisfying the “L” part of the equation, showed strong interest from Institutions and mutual funds covering the “I” part of the equation, and the stock market was in an uptrend satisfying the “M” part of the equation. Palo Alto Networks( PANW ) currently trades at the time this article was written around $180 per share. Well you may be asking yourself is it really that easy to bag a big winner? With the market pulling back twice in the second half of 2014 it wasn’t easy to hold on to growth stocks. The risks of the strategy are that growth stocks typically correct two and a half times the market averages and they can be difficult to hold. The strategy also suggest taking profits at 15% to 20% and using a stop loss of 7% to 8% from your purchase price so bagging a 150% gain requires strong conviction, discipline and patience. There are advantages and drawback within any methodology but this is certainly one that can get you in the best performing stocks when the market is good and protect you from a correction when things turn ugly. My own personal use of this strategy has protected my clients from the market crash of 2008 with a +2% return and also had me outperform the market in 2013 with a +59% return. It has most recently gotten me in such big winners as Gopro(NASDAQ: GPRO ) in 2014, Shake Shack(NYSE: SHAK ) earlier this year and big winners such as Facebook(NASDAQ: FB ) in 2013 before they all made their major price advance. In summary this is a recipe to identify huge potential winning stocks and when to buy them, and can also protect your portfolio from major damage from extreme bear markets. It is a vital tool for any growth investor to have in his or her toolbox. The next big winner is currently out their and is waiting for you to identify it! Get to know CAN SLIM! Current stocks that act well technically and fit the CAN SLIM criteria at the time this article was written: Fitbit(NYSE: FIT ),Amazon.com(NASDAQ: AMZN ), Facebook( FB ), Tableau Software(NYSE: DATA ) to name a few. These stocks merely fit the criteria and as always please do your own diligence and consult your financial professional to help you make decisions on buying or selling stocks that are suitable for your own personal risk profile. To get more information on the strategy please visit the education tab on my website at skoufiscapital.com . Investors Business daily offers great resources and learning tools at Investors.com with actionable ideas. Investors.com also offers educational courses for any level of investor. For the advanced investor who is familiar with technical analysis, visit marketsmith.com for great charting software as wells as screening tools to help identify potential leading growth stocks. Marketsmith also offers a tool to identify technical patterns and offers multiple pre built stock data bases to help you identify stocks that fit the CAN SLIM criteria. Disclosure: I/we have no positions in any stocks mentioned, and no plans to initiate any positions within the next 72 hours. (More…) I wrote this article myself, and it expresses my own opinions. I am not receiving compensation for it (other than from Seeking Alpha). I have no business relationship with any company whose stock is mentioned in this article.

New Backtests For ETFReplay Portfolio

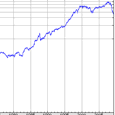
Independent research, long/short equity, dividend investing, ETF investing “}); $$(‘#article_top_info .info_content div’)[0].insert({bottom: $(‘mover’)}); } $(‘article_top_info’).addClassName(test_version); } SeekingAlpha.Initializer.onDOMLoad(function(){ setEvents();}); I am frequently asked about various strategy and portfolio performance metrics and backtests. A reader recently asked if there are any current backtests for the ETFReplay 6/3/3 Portfolio so I decided now is the appropriate time to provide updated results. The strategy background is available here and is updated monthly on Scott’s Investments , including a real-time simulated portfolio spreadsheet here . The ETFReplay portfolio is also provided free to subscribers of Portfolio123 , simply search “ETFReplay” in the Ready-to-Go Portfolio section. The backtested results below are hypothetical and do not account for commissions or taxes, so real results would be lower. The first test was conducted using ETFReplay.com , the initial inspiration for the portfolio. The backtest invests in the Screener’s picks on the close of the first day of the next period. Picks are updated monthly and the top 4 ETFs are purchased/held. ETFs must also be ranked above the iShares 1-3 Year Treasury Bond ETF (NYSEARCA: SHY ) in order to qualify for purchase. This test is nearly identical to the 6/3/3 system I update each month with the exception that the test does not require ETFs drop out of the top 5 before being sold. This was a qualification I added to the strategy to limit turnover. The benchmark for the test is the Vanguard Balanced Index Fund Inv ( VBINX): (click to enlarge) (click to enlarge) The strategy has performed well in total, but has lagged a 60/40 benchmark in the last 3+ years. The Pure Momentum ETFReplay Portfolio was added to my monthly updates in 2014. It purchases 4 ETFs each month based on 6 month returns, and has no cash filter. Backtested returns are below: (click to enlarge) (click to enlarge) We see similarly strong early results, with returns lagging versus the 60/40 benchmark the past 2+ years. Disclosures: None Share this article with a colleague