Tag Archives: stock

My Dividend Income Portfolio Update

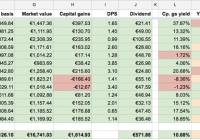
Six months ago , I decided to become a Dividend Growth Investor and become financially independent. Every month on the 8th and the 24th, I have invested €1000 in new stocks. If I keep this up, 15 years from now , my stock portfolio will grow large enough for me to be able to pay off all the monthly expenses with dividend income alone. On that day, my wife and I can retire. Today it’s February 16 . So how am I doing? Are we retired yet? Well, not yet. But my stock portfolio is doing very well. As of today, I am invested in 13 stocks with a market value of €16,741 . (click to enlarge) My portfolio is yielding a very healthy 14.46% (*) with a 3.78% yield on cost. The projected dividend for this year is €571.88, or €47.66 per month on average. (*) The total yield listed here is the sum of the capital gains yield and the yield on cost. This pretty much covers my gas bill, which is about €45 per month. So one way of looking at this income is to realize that for the entire year I will have free cooking and heating. Guess I don’t have to feel guilty about standing under the shower for more than 20 minutes. Let’s take a look at my last 3 purchases. Royal Dutch Shell (NYSE: RDS.A ) Shell caught my eye because of its high yield of 4.64% (one month ago) and low 13.8 P/E. It’s one of the cheaper high-yielding oil companies and provides me with a nice opportunity to raise the average dividend yield of my portfolio. Unfortunately, the dividend and earnings growth is not so good: respectively 2.21% and 4.56% . This is too low, as can be seen when calculating the Chowder number and Discount rate: respectively 6.49 (should be 12 or more) and 8.85 (should be 10 or more). Shell has a nice yield, but a very low dividend growth and not enough earnings growth to fund future dividend rises. So why go for this stock? I confess: I bought Shell partly out of nostalgia. My father worked at Shell for almost his entire career, and I have happy childhood memories of their bring your kids to work days at the KSLA building in Amsterdam. But another reason for buying Shell is that there is no indication that the company is in any kind of existential trouble. I take the long view and expect good results from this stock in the next 20-30 years, when worldwide oil reserves start to dry up. Oil prices will eventually rise again, Shell will flourish, and the company has a very good reputation of rewarding shareholders with dividend. I expect this stock to do fine. But it might take a few years. Philip Morris (NYSE: PM ) Now here is a stock with much better metrics. Philip Morris is the golden boy of many dividend growth investors right now. A 4.63% yield and a 17.29 P/E make this company an affordable high-yielder. But things get really interesting when looking at historic growth. PM has been growing its dividend at a healthy 18.38% (5-year CAGR), which contributes to an impressive Chowder value of 23.06 . But what about earnings? PM has got that covered too, with a 5-year EPS CAGR of 9.64% , which contributes to a discount rate of 14.32 . The DPR is 76.6% , which is in line with other tobacco companies. For example, British competitor BATS has a DPR of 74.3% . All metrics look good on this stock, and so I pulled the trigger and bought 14 shares. National Oilwell Varco (NYSE: NOV ) I bought NOV back in December at €55.90 per share, which gave me a dividend yield of 2.5%. One month later, the stock has dropped to a feeble €46.80. I lost 16% of my investment. Many people would panic at this point. Buying a stock and then seeing it drop in value is scary. You’re supposed to buy low and sell high, right? So when a stock drops after you buy, you need to get rid of it as quickly as possible, cut your losses, and try again. Actually, no. That’s a terrible strategy. At its new price, NOV has a yield of 3% , which is 0.5% higher than when I bought it. So if I buy more shares, the average yield of my NOV position actually rises to 2.75% , and I will receive €2.50 in extra dividend. This is called ‘averaging down’, and it is one of the golden rules of dividend growth investing. When the stock price drops, you buy more. Of course, this strategy fails completely if the company is going bust. So how are they doing? Well, fine actually. The 5-year DPS CAGR is an astounding 74.33% , and EPS growth a hefty 10.69% . This gives a Chowder value of 77.35 and a discount rate of 13.72 . And their DPR is only 23.50 , which is very low for an oil company. So there is more than enough earnings growth to finance NOV’s over the top dividend growth in the near future. In fact, my ranking formula places NOV just below Apple (NASDAQ: AAPL ). And remember, Apple has a 5-year dividend growth rate of 118.25% , which is just plain crazy. I don’t think you can go wrong with this stock. I bought 21 new shares. My portfolio today My portfolio today has a yield of 14.46% . The best-performing stock in my portfolio is Apple with a total yield of 39.97% . (click to enlarge) I rank my portfolio by ChowderDiscount (the sum of the Chowder number and the Discount value) and YDPR rank (which measures the spread between yield and payout ratio). My best ranking stock is Apple with a combined rank value of 2.61 . (click to enlarge) The market value of my portfolio today is €16,741 . (click to enlarge) My portfolio is well diversified over industry sectors, even though ‘Oil and gas’ is getting a bit large: I’m also diversified over three currencies. A good start, but it’s clear I need to buy more UK stock in the future:
NYSE Margin Debt Dips A Mite In December: Risk Rank At No. 43

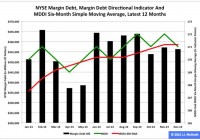
Summary New York Stock Exchange margin debt slipped slightly to $456.28 billion in December from $457.11 billion in November. On the same basis, the SPDR S&P 500 Trust ETF’s adjusted closing monthly share price also slipped slightly to $205.54 from $206.06. The risk of speculation appeared lower in December than it did in November, but higher than it did in 69.93 percent of all months ranked by my methodology. New York Stock Exchange margin debt and the SPDR S&P 500 Trust ETF (NYSEARCA: SPY ) moved in the same direction in December for the second straight month, as each was down a wee bit. The level of NYSE margin debt relinquished -$823 million, or -0.18 percent, and the share price of SPY surrendered -$0.52, or -0.25 percent. Many equity market participants consider margin debt a long-term indicator of speculation in the stock market because of their tendency to move either higher or lower together. The NYSE has reported monthly data on securities market credit in three discrete series since 2003 and on margin debt itself since 1959. My primary analyses of these three data series focus on two proprietary metrics, the Margin Debt Directional Indicator, or MDDI, and the Securities Market Credit Risk Rank , or SMC Risk Rank, as described in “NYSE Margin Debt As An Indicator Of Long-Term Movements In S&P 500.” Figure 1: MDDI, January 2014-December 2014 (click to enlarge) Source: This chart is based on a proprietary analysis of monthly margin-debt data at NYSE’s online site. NYSE margin debt in December was -$9.44 billion, or -2.03 percent, lower than it was at its all-time high level in February (Figure 1). The anomalous behavior of margin debt in neither falling a great deal nor rising a great deal during the rest of 2014 appears unsustainable, factoring in the U.S. Federal Reserve’s actual announcement of the end of its latest quantitative easing program Oct. 29 and projected announcement of the beginning of its newest interest rate cycle April 29. This anomalous behavior is reflected by the MDDI, which basically is a comparative assessment of NYSE margin debt in the two most recent months of the data series. If the latest value of the MDDI ( MDDI in the above figure) is higher than its six-month simple moving average ( MDDI 6M SMA in the same figure), then I consider the market to be in bullish mode. If the most recent value of the MDDI is lower than its six-month SMA, then I consider the market to be in bearish mode. The MDDI’s December level is 171, which is lower than its November value of 172 and its six-month SMA of 171.17. As a result, I consider the equity market to have switched modes as of Dec. 31, to bearish from bullish. Based on the January performances of the stock market in general and SPY in particular, I anticipate a continuation of this mode for another month (at least). Figure 2: Highest And Lowest Risk Months, Per SMC Risk Rank (click to enlarge) Source: This table is based on proprietary analyses of monthly securities-market-credit data at NYSE’s online site. December is No. 43 among all 143 months evaluated since the January 2003 baseline by my SMC Risk Rank methodology, which carries out a comparative assessment of the data NYSE has reported in three discrete series: Margin Debt , Free Credit Cash Accounts and Credit Balances in Margin Accounts . The dynamic SMC Risk Rank is designed as a measure of equity market risk associated with speculation, ranking each month in the data set on an ongoing basis. At present, June 2014 is No. 1 , February 2014 is No. 2 and December 2013 is No. 3 among all months ranked (Figure 2). November’s SMC Risk Rank of No. 43 means I consider the stock market risk associated with speculation last month was higher than 69.93 percent and lower than 29.73 percent of all other months evaluated by the methodology. A high SMC Risk Rank for a given month indicates the market may be close to a significant peak, and a low SMC Risk Rank for a given month suggests the market may be close to a significant trough. In my interpretation, the term close in this context typically has meant within three to six months . Figure 3: NYSE Margin Debt And SPY, January 1993-December 2014 (click to enlarge) Source: This chart is based on monthly margin debt data at NYSE’s online site and adjusted closing monthly share prices of SPY at Yahoo Finance . Historically, NYSE margin debt and SPY have tended to move together, with an almost perfect positive correlation coefficient of 0.97 between them since the exchange-traded fund began trading in 1993 (Figure 3). I anticipate this close relationship will become increasingly important in the absence of Federal Reserve asset purchases under a QE program. If I were a party to either side of a margin debt transaction, then this is the time when I would start wondering whether more speculation is the wisest way to go. Disclaimer: The opinions expressed herein by the author do not constitute an investment recommendation, and they are unsuitable for employment in the making of investment decisions. The opinions expressed herein address only certain aspects of potential investment in any securities and cannot substitute for comprehensive investment analysis. The opinions expressed herein are based on an incomplete set of information, illustrative in nature, and limited in scope. In addition, the opinions expressed herein reflect the author’s best judgment as of the date of publication, and they are subject to change without notice. Disclosure: The author has no positions in any stocks mentioned, and no plans to initiate any positions within the next 72 hours. (More…) The author wrote this article themselves, and it expresses their own opinions. The author is not receiving compensation for it (other than from Seeking Alpha). The author has no business relationship with any company whose stock is mentioned in this article.

Microsoft does to outlook ‘what the Patriots do to footballs’

With the Windows XP upgrade cycle over and the release of Windows 10 still months away, Microsoft’s (STOCK) business has hit a soft patch. The Redmond, Wash.-based software giant late Monday delivered better-than-expected December-quarter sales and earnings, but forecast March-quarter sales way below Wall Street targets. Jefferies analyst John DiFucci said Microsoft did to expectations “what the Patriots do to footballs,” a reference to the hot story about whether NFL team deflated balls. Microsoft (MSFT)  was down 9% in midday trading in the stock market today, below 43 and just pennies above what would be a more than six-month low. A wave of Wall Street analysts cut their ratings and price targets on Microsoft stock after the earnings news. Citi cut its rating to sell from neutral. JPMorgan, Nomura and MKM Partners downgraded the stock to neutral. “After a lengthy 16-month period of multiple expansion for Microsoft’s stock, we see a…