Tag Archives: spy

U.S. REIT ETFs: Correlations

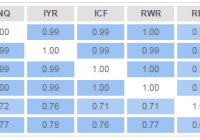
REIT ETFs appear to offer an improvement to the overall portfolio performance. Correlations to the S&P 500 were in the low to mid 0.50s in the last 12 months. The largest U.S. REIT ETFs are fairly homogeneous with correlation coefficients of 0.98-1.00 between themselves. Real estate is often mentioned as a stand-alone asset class next to equities, fixed income and commodities. This notion prompts investors to allocate a portion of their portfolios to the real estate investment trusts (“REITs”) in pursuit of diversification benefits. In this article, I review how the U.S. REIT ETFs fit into the overall portfolio and whether they help to improve the performance. The analysis focuses on the five largest U.S. REIT ETFs that have been around for at least 5 years and manage over $1 billion of assets each (in descending order by size): Vanguard REIT Index ETF (NYSEARCA: VNQ ), iShares U.S. Real Estate ETF (NYSEARCA: IYR ), iShares Cohen & Steers REIT ETF (NYSEARCA: ICF ), SPDR DJ Wilshire Global REIT ETF (NYSEARCA: RWR ), and iShares Mortgage Real Estate Capped ETF (NYSEARCA: REM ). All the calculations were carried out on the freely available investor resource InvestSpy. To start with, let’s look at the correlation matrix of these ETFs plus the SPDR S&P 500 Trust ETF (NYSEARCA: SPY ), utilizing 5 years of historical data: The table above presents us with two important insights. Firstly, all REIT ETFs had a correlation coefficient with the broad equity market no higher than 0.78. Although such a reading indicates a relatively close co-movement, it is low enough to offer diversification benefits. Secondly, the four largest REIT ETFs (VNQ, IYR, ICF, and RWR) had almost perfect correlation of 0.99-1.00 between themselves. This means that from an investor’s standpoint, these are pretty much identical securities, thus it is worthwhile paying more attention to expense ratios and bid-ask spread when making a selection. The only standout is REM, which demonstrates a lower correlation both with SPY and with the remaining REIT ETFs. This is due to the fact that REM is a mortgage REIT, thus it behaves somewhat differently from equity REITs. Five years is fairly long period of time and it is useful to investigate correlations in the more recent past. Below is the same correlation matrix, utilizing daily data for the last 12 months only: It appears that the close co-movement between the four equity REIT ETFs persisted to the same degree whilst REM deviated even further from the traditional REIT class with its correlation coefficients no higher than 0.70. Interestingly, correlations with the broad U.S. equity market dropped across the board to as low as 0.49 in the case of ICF. As all of these ETFs except for REM posted positive total returns similar to the S&P 500 over the last year, it is clear that investors that had allocation to REITs in this period achieved an improved risk/reward performance. Just to illustrate the difference a 20% allocation to REIT ETFs would have made, consider a standard 60% equities/40% bonds portfolio where 20% of equity allocation is replaced with a REIT ETF. A portfolio with 60% invested in the Vanguard Total Stock Market ETF (NYSEARCA: VTI ) and 40% in the iShares Core Total U.S. Bond Market ETF (NYSEARCA: AGG ) would have brought the following results in the last year: (click to enlarge) Meanwhile, with 20% allocated to VNQ, the dynamics change a little bit: (click to enlarge) The key metric I am looking at here is the annualized volatility. Note that even though we have replaced VTI with a riskier VNQI (12.1% vs. 14.4% volatility), the overall portfolio volatility has decreased from 7.0% to 6.8%. This is the diversification benefit in its purest sense. In addition to that, the total return and maximum drawdown figures are the same for both portfolios whilst the second one is substantially less dependent on the broad equity market with a beta below 0.50. It is also clear that risk contributions are largely skewed away from fixed income, but this a classical case in most of traditional portfolios as I have covered here , and this topic requires a separate discussion. Summing up, U.S. REIT ETFs appear to offer an improvement to the overall portfolio performance. The largest ETFs in this space are extremely highly correlated, thus an investor needs to look more closely at ETF features such as expense ratio and bid-ask spread to identify the most efficient option. Finally, correlations change over time and so does the diversification benefit. Therefore, one has to monitor periodically if their asset class allocation is delivering performance as anticipated. Please share your thoughts and feedback on the insights above. In the next article later this week, I will present a similar analysis for international REITs. Disclosure: I/we have no positions in any stocks mentioned, and no plans to initiate any positions within the next 72 hours. (More…) I wrote this article myself, and it expresses my own opinions. I am not receiving compensation for it (other than from Seeking Alpha). I have no business relationship with any company whose stock is mentioned in this article.
Asia Ex-Japan And U.S. Large-Cap Value: Two ETFs Trading With Outsized Volume

In the past trading session, U.S. stocks were in the mixed-to-positive territory with the China currency issue deciding the course of the market. For the top ETFs, investors saw SPDR S&P 500 Trust ETF (NYSEARCA: SPY ) gain about 0.1%, SPDR Dow Jones Industrial Average ETF (NYSEARCA: DIA ) add 0.06%, and PowerShares QQQ Trust ETF (NASDAQ: QQQ ) move higher by about 0.4% on the day. Two more specialized ETFs are worth noting in particular though, as both saw trading volume that was far outside of normal. In fact, both these funds experienced volume levels that were more than double their average for the most recent trading session. This could make these ETFs ones to watch in the days ahead to see if this trend of extra-interest continues: iShares MSCI All Country Asia ex-Japan Index ETF (NASDAQ: AAXJ ): Volume 3.14 times average. This all-country Asia ex-Japan ETF was in focus yesterday as roughly 4.13 million shares moved hands compared to an average of roughly 1.31 million. We also saw some stock price movement as shares of AAXJ lost over 1.7% yesterday. The movement can largely be blamed on the latest Chinese currency devaluation which sparked off a currency war fear among these Asian nations to maintain their export competitiveness as these can have a huge impact on Asian stocks like what we find in this ETF’s portfolio. For the month, AAXJ is down 7.9% and has a Zacks ETF Rank #3 (Hold). iShares Morningstar Large-Cap Value ETF (NYSEARCA: JKF ): Volume 3.13 times average. This U.S. large-cap value ETF was under the microscope yesterday as nearly 28,300 shares moved hands. This compares to an average trading day of 9,050 shares and came as JKF added about 0.2% on the session. The move was the result of a sudden lift in value quotient in the market, thanks to the rout in the global market due to the Chinese currency episode. JKF was down about 1.3% in the past month; though the fund currently has a Zacks ETF Rank #3. Original Post Share this article with a colleague

Special Events ETFs – Not What You Think

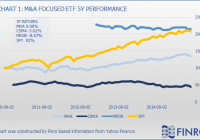
Summary Special events are investing can significantly increase the portfolio return. Many investors interested in the returns of special events investing don’t want to trade these events actively. Here is why ETFs following special events indexes are not a good enough substitution. It is widely accepted that special situations investing can drive higher returns in the long run than a simple long-only investing methodology. For most investors engaging in merger arbitrage, spin-off and IPOs require too much time and effort, so they prefer to use ETFs to mimic this kind of investing. The rationale is easy to articulate in these cases: M&A, spin-offs, and IPOs were extremely successful strategies to many funds, so I, as a common investor, could copy their moves by investing in these ETFs. Well, not exactly. M&A Focused ETFs In the merger arbitrage area, there are three ETFs trying to generate excess return by engaging in merger arbitrage strategy; however, as shown in the table below, all three ETFs generated inferior performance compared to the popular SPDR S&P 500 ETF (NYSEARCA: SPY ) in every period. Symbol Name 3M 6M YTD 1Y 2Y 5Y SPY SPDR S&P 500 ETF -1.75% 1.61% 1.16% 7.29% 22.80% 92% MNA IQ Merger Arbitrage ETF -2.56% -0.53% 1.11% 3.52% 6.93% 9.98% CSMA Credit Suisse X-Links Merger Arbtrg ETN -1.97% 0.15% -0.21% -2.95% -6.72% -3.09% MRGR ProShares Merger -0.84% -0.19% 0.91% -0.16% -3.35% -8.38% Source: Table constructed by Finro based on information from Yahoo Finance The largest fund and best-performing ETF in the merger arbitrage focused ETFs is MNA, the IQ Merger Arbitrage ETF that generated only ~10% return over the last 5 years which is extremely lower than SPY’s 92%. The chart below illustrates it best as the three M&A ETFs are mostly flat over the last five years while SPY climbs. Does it mean that investors should not engage in merger arbitrage strategies to generate an excess return from special situations? Of course not, however, the passive investment offered by these ETFs probably does not fit the merger arbitrage investment strategy profile. Active funds and managers who use this approach can pick and choose the deals they want to engage in and how much funding to allocate to each deal. However, ETFs (and ETNs) are required to follow a particular index in a passive investment methodology that is probably hard to fit a merger arbitrage strategy into. This is presented best in Chart 2 below, which shows the inherent problem with merger arbitrage ETFs – the indexes they follow don’t offer any added value over the S&P 500. In this example, the Credit Suisse Merger Arbitrage Liquid Index is relatively flat from Dec-09 while S&P is a bit more volatile, but it drives more than a 90 percent return on the same period. Spin-Off and IPO-Focused ETFs The other two areas mentioned at the beginning, spin-offs and IPOs, present a different story. IPO and Spin-Off ETFs invest in long-only positions in the stock of companies that have recently gone public or spun off from parent companies. These strategies are a better fit in a passive investment methodology that is a simple long in most cases. As shown in the table below, the two IPO ETFs differ in performance. While First Trust US IPO ETF (NYSEARCA: FPX ) beat SPY in most time periods chosen, the Renaissance IPO ETF (NYSEARCA: IPO ) offers inferior returns in most periods. The Guggenheim Spin-Off ETF (NYSEARCA: CSD ) provides exposure to the vibrant spin-off sector that has been very popular lately, but it also suffers from slightly inferior returns compared to SPY in the shorter periods studied. Symbol Name 3M 6M YTD 1Y 2Y 5Y SPY SPDR S&P 500 ETF -1.75% 1.61% 1.16% 7.29% 22.80% 92% IPO Renaissance IPO ETF 1.20% 0.22% 1.75% 4.36% 14.16% N/A FPX First Trust US IPO ETF -4.88% 9.50% 9.31% 15.51% 31.04% 179.90% CSD Guggenheim Spin-Off ETF -6.90% -4.06% -2.41% -1.62% 11.42% 130% Source: Table constructed by Finro based on information from Yahoo Finance Market Vectors Global Spin-Off ETF (NYSEARCA: SPUN ), a new Spin-Off ETF, started trading in June. It has generated a slightly better return since its inception than CSD in the same time period: -6.7% and -7.3%, respectively. Final Thoughts Special events investing is a tremendous way to achieve an excess return for a portfolio by monetizing mergers and acquisitions, spin-offs or IPOs. There are some ETFs following indexes of merger arbitrage, spin-offs or IPOs. However, most of them do not outperform SPY, and that is a huge disadvantage. While I firmly believe every investor should allocate some of his or her portfolios to special events investing, I think, as presented above, that active investment strategies like those require active investment decisions. Except FPX and IPO investing, engaging in active investment strategies through passive investment vehicles just doesn’t work – to monetize these events, investors should actively invest in them selectively. The FPX holds the top-ranked 100 newly traded companies for the first 1,000 days on the market – which is a more simple methodology to follow through an ETF than the other strategies. Investors can use the FPX for an IPO exposure without the need to actively trade these events. Other than this particular example, I believe investors should trade actively when trying to engage in active strategies like M&As and spin-offs. Disclosure: I am/we are long SPY. (More…) I wrote this article myself, and it expresses my own opinions. I am not receiving compensation for it (other than from Seeking Alpha). I have no business relationship with any company whose stock is mentioned in this article. Additional disclosure: The information provided in this article is for informational purposes only and should not be regarded as investment advice or a recommendation regarding any particular security or course of action. This information is the writer’s opinion about the companies mentioned in the article. Investors should conduct their due diligence and consult with a registered financial adviser before making any investment decision. Lior Ronen and Finro are not registered financial advisers and shall not have any liability for any damages of any kind whatsoever relating to this material. By accepting this material, you acknowledge, understand and accept the foregoing.