Tag Archives: splv

It’s A Risk Adverse World Out There

Summary Investors have been pulling back on the risk handle for some time now and shedding areas of their portfolio that may be susceptible to heightened volatility. The interesting thing about the high beta index is that it contains some very big winners this year. This has created a wide chasm between the so called “safe stocks” and “aggressive stocks”. Investors have been pulling back on the risk handle for some time now and shedding areas of their portfolio that may be susceptible to heightened volatility. Virtually anything connected to the energy or materials sectors has been torched this year. That extends to emerging market countries and high yield bonds , which have also felt the effects of the commodity crash. One of the more creative ways to view this trend is to look at the disconnect between high beta stocks and low volatility names. The PowerShares S&P 500 High Beta Portfolio (NYSEARCA: SPHB ) and PowerShares S&P 500 Low Volatility Portfolio (NYSEARCA: SPLV ) are two excellent indexes for this task. These two ETFs invest in a basket of 100 stocks within the S&P 500 universe that are showing the highest and lowest sensitivity to the benchmark over the last 12-months. Each stock within the portfolio is given an equal share (1%) of the asset allocation and the underlying holdings are evaluated and rebalanced on a quarterly basis. As you can see on the chart below, the divergence between the two has really accelerated over the last three months. SPLV is now trading within close proximity to all-time highs, while SPHB is quite near its 2015 lows. The interesting thing about the high beta index is that it contains some very big winners this year. Netflix Inc (NASDAQ: NFLX ) and Expedia Inc (NASDAQ: EXPE ) are both in the top 10 holdings of this fund and continue to show relative strength. Nevertheless, over one-third of the portfolio is made up of energy and industrial companies that have seen their share prices crater. Two of the worst have been Freeport-McMoRan Inc (NYSE: FCX ) and Chesapeake Energy Corp (NYSE: CHK ). By contrast, the low volatility sectors in SPLV are primarily geared towards financial and consumer staples names. Many of these stocks have either moved sideways in a plodding fashion or continued to buck the overall market malaise by heading higher. This has created a wide chasm between the so called “safe stocks” and “aggressive stocks”. On a year-to-date basis, SPHB is down -7.50% versus a 2.90% gain in SPLV. For comparison purposes, the benchmark SPDR S&P 500 ETF (NYSEARCA: SPY ) is up just 2.00% so far this year. While it’s easy to dismiss this divergence as simply a difference in index construction, I believe it also represents an excellent example of investor behavior and risk characteristics . High beta stocks are known to experience very rapid rallies during favorable market environments, but that also translates into quick breakdowns when the tide turns. Much of this fundamental risk versus reward has been forgotten or dismissed over the last several years as stocks march higher with very little in the way of volatility or fear. Earlier in the year, I transitioned a portion of the equity sleeve in my Strategic Income portfolio to the iShares MSCI U.S.A. Minimum Volatility ETF (NYSEARCA: USMV ). This fund takes a similar tact as SPLV by selecting a subset of stocks with lower overall price fluctuations than the broader market. These indexes are designed for more conservative investors that still want to participate in the upside of the market with less downside risk. One drawback to owning this fund in an income portfolio is that I am sacrificing some short-term yield by not owning a strict dividend-focused index. In addition, I could potentially miss out on a big rally in high yield or beaten down stocks. Yet based on the current market environment, I feel that this strategy is prudent to lower the beta of the portfolio and focus on total return. The Bottom Line In a true bear market or crisis situation, there is no such thing as a “safe stock”. Even low volatility indexes are going to experience sizeable declines as risk aversion sets in. However, that same risk is also rewarded during periods of cyclical strength in equities. By being proactive with your asset allocation and security selection, you can reduce your risk during unfavorable periods and take advantage of new opportunities when they fit your criteria. Disclosure: I am/we are long USMV. (More…) I wrote this article myself, and it expresses my own opinions. I am not receiving compensation for it. I have no business relationship with any company whose stock is mentioned in this article. Additional disclosure: David Fabian, FMD Capital Management, and/or clients may hold positions in the ETFs and mutual funds mentioned above. The commentary does not constitute individualized investment advice. The opinions offered herein are not personalized recommendations to buy, sell, or hold securities.
Revisiting The 100 Stocks With The Lowest Volatility In S&P 500 Index

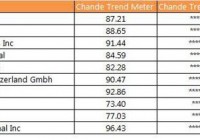
Summary We expand the discussion from a recent Editor’s Pick on building portfolios with the lowest volatility stocks in the S&P 500 Index. We point out that high beta is not necessarily high momentum and discuss why low volatility stocks might provide stronger performance. We simulate the portfolio construction calculations behind the S&P 500 Low Volatility Index and construct the current Top-10 portfolio holdings. We re-rank the lowest volatility stocks by momentum metrics to find stocks trending higher even in the current choppy market conditions. Introduction In a recent Editor’s Pick , Ploutos discussed the relative merits of using low volatility and high beta funds to generate better returns than the SPX (Ref 1). He combined the PowerShares S&P 500 Low Volatility Portfolio (NYSEARCA: SPLV ) and the PowerShares S&P 500 High Beta portfolio (NYSEARCA: SPHB ) to improve returns. His analysis is open to two criticisms. First, he was using a high beta portfolio as a substitute for a momentum strategy. However, high beta does not necessarily mean high momentum. Naturally, these terms are not cast in stone, and differences in calculation methodology and time period of data used in the analysis can change the measured beta as well as calculated momentum. So, for example, a fund like the PowerShares DWA Momentum Portfolio (NYSEARCA: PDP ) could be substituted for the SPHB portfolio. Second, he does not discuss why a stock may have low volatility, why a group of 100 stocks with the lowest volatility had returns greater than the full 500-strong index, and why this outperformance should persist for years on end. Thus, it is theoretically possible to go through a prolonged period during which the 100 stocks with the lowest volatility as a group do not consistently outperform the full index or their high-beta cousins quarter after quarter, and two groups flip flop back and forth negating any benefit of switching from one group to another. Why do stocks have low volatility? There are many reasons a stock could have low volatility. A stock may have low volatility because it has slow earnings growth and does not have the price amplitude, volume and spreads to catch the fancy of short-term traders. The stock may have large institutional ownership, and any dip in the stock leads to greater accumulation by institutions, so that large drops are rare. The earnings could be highly predictable and consistent, so the stock does not produce either positive or negative earnings surprises. The stock could have a large dividend payout, so it trades more like a bond than a stock. The stock could have gone through a period of very high volatility, that has shaken “weak longs” out of the stock, and volatility has diminished as the stock goes through a consolidation. A stock may be viewed as having a conservative management with high cash-flow, slow-growth businesses, that are not sensitive to strength or weakness in the economy. Hence, low volatility could be proxy for slow growth, high cash generators with large institutional ownership that are perceived as “low risk” investments. Thus, the exact reasons that a stock has low volatility over a given period and its implications for price advancement over the immediate future are unclear. Also, there could be numerous other reasons for low volatility in a stock. Why do low volatility stocks outperform the full index? In the ideal scenario, a stock has low volatility, is accumulated, and volatility increases due to favorable developments in the stock, such as improved growth prospects, and the stock breaks out into a strong trend. For example, management could focus on cutting costs and buying other companies with higher-margin products in the same sector. Thus, trading low volatility becomes a counter-trend entry into a stock that will morph into a growth story in the future. In this scenario, this stock starts off as a low volatility entity that shifts gears into a high growth phase, accounting for its outperformance. Of course, it will eventually drop off the 100-lowest volatility list, but then, its substitute will ideally repeat the same pattern. Alternately, the external market environment deteriorates, due to a weak economy or geo-political risks, prospects for price acceleration are murky or confusing, and money comes out of high-beta or high-volatility stocks and rotates into low-volatility stocks, being used as a temporary hedge or defensive position against market worries. These conditions could last for several quarters, and would again account for out-performance versus the full index. Naturally, there could many other possibilities for why low volatility stocks perform better than the index as a whole, such as buy-outs, rising dividends or a prolonged period of very low interest rates. Current State of Play: SPLV ETF As we have discussed above, low volatility does not have to mean low returns, especially when these stocks are used as a bulwark against market uncertainty. We perform a full trend analysis of the top-10 holdings of the PowerShares SPLV ETF (see Figure 1) below. The Top 10 are trending well, with good buying support for CB and BAX in particular. (click to enlarge) Figure 1: The current Top-10 holdings in the SPLV ETF are trending well given all the uncertainty in the market. (Data courtesy ETFmeter.com ) Updated Holdings through August 6 We asked the question: what would the current top 10 look like? We copied the methodology of the index and our updated top-10 holdings are shown in Figure 2. From Figure 1, XL Company (NYSE: XL ) and Stericyle (NASDAQ: SRCL ) are the only two companies in the top 10. One can then argue that an equally weighted portfolio would be better, since the rebalancing would only involve stocks which dropped out of the 100 least volatile stocks group. Figure 2: We update the portfolio weights using data through August 06 and the methodology described by the index provider. Only two of stocks, XL and Stericycle from the current top-10 in the SPLV ETF are on the list. (Data courtesy ETFmeter.com) The Best Trending of the 100 Lowest Volatility Stocks We can now ask the question: which are the best trending of the 100 stocks with the lowest volatility in the S&P 500 index? How are they doing? If money is rotating into low-volatility stocks in the face of market worries, then the 10 best trending stocks out of the 100 stocks with the lowest volatility in the S&P 500 index should be largely defensive stocks with steady earnings. We check this hypothesis in Figure 2 below using data through August, 06 2015. We find that out of the lowest 100 stocks, seventeen stocks seem to be surging, and we show them in Figure 3. The charts are somewhat similar, and we show the charts of Kellogg (NYSE: K ) and Clorox (NYSE: CLX ) to illustrate this idea (see Figures 4 and 5). Figure 3: The 17 stocks with the strongest trends in the 100 stocks with the lowest volatility in the S&P 500 index are a who’s who of defensive stocks. (Data courtesy ETFmeter.com) (click to enlarge) Figure 4: The Kellogg chart is rising strongly during the recent market uncertainty after analyst upgrades. (Chart courtesy StockCharts.com) (click to enlarge) Figure 5: The chart for Clorox looks quite similar to the one in Figure 4, showing the defensive rotation into low volatility stocks. (Chart courtesy StockCharts.com) Summary The low volatility group in the S&P 500 index can offer a respite in the rough seas of a choppy market. There are many alternatives to constructing portfolios with the lowest 100 volatility stocks and combining them with high beta and pure momentum strategies. Disclosure: I/we have no positions in any stocks mentioned, and no plans to initiate any positions within the next 72 hours. (More…) I wrote this article myself, and it expresses my own opinions. I am not receiving compensation for it. I have no business relationship with any company whose stock is mentioned in this article.

Evaluating U.S. Low-Volatility ETFs: USMV Vs. SPLV

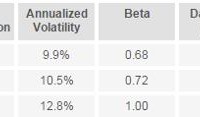
Low-volatility ETFs have close to $20 billion in AUM. Both USMV and SPLV achieve their objectives against the benchmark. USMV has been the more efficient and cheaper choice than SPLV thus far. Ever since I wrote my thesis on minimum-variance portfolios six years ago, I have maintained a strong interest in low-volatility investing. This type of investment has gained popularity over the last few years with the US markets now featuring 21 low-volatility ETFs that have combined assets under management of almost $20 billion. I have decided to take a look at how the largest funds in this space have performed from the risk perspective. For the purpose of this analysis, I have focused on the two flagship low-volatility ETFs – the iShares MSCI USA Minimum Volatility ETF (NYSEARCA: USMV ) and the PowerShares S&P 500 Low Volatility Portfolio ETF (NYSEARCA: SPLV ) – which have around $5 billion of AUM each. Both of these funds invest solely in the US stock market, making them easy to compare. The SPDR S&P 500 Trust ETF (NYSEARCA: SPY ) is used as the benchmark. Utilizing the freely available investor tool on InvestSpy and using the full data history, I obtained the following results: (click to enlarge) The table above reveals that both USMV and SPLV demonstrated substantially reduced beta and realized volatility than SPY. However, the degree of success differed, as USMV had a lower beta (0.68 vs. 0.72) and lower realized volatility (9.9% vs. 10.5%) compared to SPLV, making the former a superior performer from the risk perspective. In addition to that, USMV delivered a 6.7% higher total return than SPLV whilst both low-volatility ETFs trailed SPY. Looking at the correlations computed on the same analytical website, it turns out that both funds had a correlation with SPY of 0.88. Although the figure is relatively high, this is still a favorable finding given that these funds invest pretty much in the same universe of stocks as SPY. Analyzing the data only for the last year yields a similar result, as USMV again outperforms SPLV in all respects. However, the overall benefit from the low-volatility phenomenon has been weaker over the last 12 months, as beta values increased above 0.8 and annualized volatility was much closer to that of SPY’s, particularly in the SPLV’s case. (click to enlarge) The correlation coefficients have also changed in the past year with USMV and SPLV moving even closer together. It is interesting to note that USMV’s correlation coefficient with SPY has increased sharply to 0.95, making it a less desirable portfolio component from the diversification perspective. Summing up, USMV appears to have beaten SPLV thus far virtually in all respects, posting lower beta, lower realized volatility and higher returns. In addition to that, USMV was also a cheaper alternative, charging 0.15% as opposed to 0.25% by SPLV. However, it is important to note that markets constantly evolve and investors should monitor the performance of “smart beta” products on a regular basis. It is hard to make a case for SPLV now, but a simple change such as the recent spike in correlation with the S&P 500 may easily put USMV out of favor. Disclosure: I/we have no positions in any stocks mentioned, and no plans to initiate any positions within the next 72 hours. (More…) I wrote this article myself, and it expresses my own opinions. I am not receiving compensation for it (other than from Seeking Alpha). I have no business relationship with any company whose stock is mentioned in this article.