Tag Archives: social-networking

A Year-End Review Of ROBO, The Robotics And Automation ETF

Summary The ETF’s percentage of large-cap holdings has declined by 9% since February 2014. Since February 2014, there has been an increase in riskier mid-cap, small-cap and micro-cap holdings within this ETF. Kuka AG and Krones AG are leading performers of the Robo Global Robotics and Automation Index ETF while Omron Corporation and Oceaneering International Inc. are leading laggards. The Robo Global Robotics and Automation Index ETF’s high expense ratio and increased exposure to riskier stocks makes the fund a risky investment. Just like Robin Roberts performs a year-end wrap-up of the year 2015, it is only appropriate that I perform a year-end analysis of the Robo-Stox Global Robotics And Automation Index ETF (NASDAQ: ROBO ) This exchange-traded fund was fortunate enough not to suffer the same fate as the now liquidated 3D Printing, Robotics and Technology Fund (MUTF: TDPIX ). As of the date of this article, the Robo Global Robotics and Automation Index ETF’s total YTD Performance was -4.73%. However, the funds has picked up momentum over the past three months with a gain of 10.54% over that span. Without further ado, it is time for me to perform an in-depth dissection of this fund. The Robo Global Robotics and Automation Index ETF has a high expense ratio of 0.95%. This is 0.30% higher than the expense ratio category average . The following chart illustrates the fund’s weight in terms of giant, large, mid, small and micro-cap stocks when I analyzed this fund in February 2014 . Size % of Portfolio Benchmark Category Average Giant 12.02 56.05 46.73 Large 17.80 21.14 13.74 Medium 40.85 17.44 25.91 Small 13.39 5.24 10.90 Micro 15.94 0.13 2.73 As you can see by the following chart, the percentage of large-cap holdings in the fund has declined by over 9% from nearly two years ago and is well below its category average. Meanwhile, you can see that there has been a percentage increase in the mid-cap, small cap and micro-cap stocks of this fund. These statistics are as of 12/23/2015. Size % of Portfolio Benchmark Category Average Giant 11.22 42.29 3.56 Large 8.79 31.26 28.17 Medium 44.89 19.80 52.11 Small 18.09 6.24 12.66 Micro 17.01 0.41 3.50 LEADERS OF ROBO GLOBAL ROBOTICS AND AUTOMATION INDEX ETF In terms of coming up with the top performers in the fund, I took into account both the portfolio weight and YTD Return of the holdings. KUKA AG ( OTCPK:KUKAF ) = KUKA AG is an automation firm that develops and gives sells robotic systems internationally under the KUKA brand. KUKA AG has the 8th best portfolio weight at 2.14%, yet had an YTD return of 37.10%. Currently, KUKA AG is trading at $87.74 and is coming off of a solid third quarter performance . KUKA AG’s garnered a 25% in orders received and a 34% increase in sales revenues. These increases included totals from the Swisslog division, which was not consolidated in the previous year. The firm’s robotics division increased by 20% in terms of orders received, yet its sales revenues declined by 7% for the quarter. According to its report, KUKA AG have benefited from increased car sales in its three biggest markets, Western Europe, China and the U.S. Car sales in Western Europe, China and The U.S grew by 8.7%, 5.5% and 5% respectively for the first nine months in 2015. KUKA expects to benefit from further growth in these markets. KRONES AG ( OTC:KRNNF ) – Krones AG is responsible for the planning, developing and manufacturing machinery and systems for the process technologies and intralogistics arena in Germany as well as worldwide. Krones AG has a 2.06% portfolio weight and has an YTD return of 34.35%. Krones is trading at $108.25. Its latest report revealed that Krones AG was right on target in terms of meeting its target objectives. Krones AG’s revenue and net orders has increased by 4.9% and 5.2% respectively. The firm’s EBIT, EBT and Net Income increased by 14.8%, 14.2% and 13.9% respectively. LAGGARDS OF ROBO GLOBAL ROBOTICS AND AUTOMATION INDEX ETF It would be easy for me to point the finger at the struggling 3-D Printing stalwarts of 3D Systems Corp (NYSE: DDD ) and Stratasys (NASDAQ: SSYS ). Both have YTD Returns of -69.29% and -69.12%. However, both holdings hold portfolio weights of less than 1%. Thus, both holdings do not hold enough significance to the fund at this point. However, Omron Corporation (OMR) has a hefty portfolio weight of 2.12% and has a negative YTD Return of -22.50%. In their latest half-year report, Omron Corporation’s revenue increased year-over-year by 2.2%. Yet, the company’s net income declined by -27.3% to $24.5 million dollars. Omron’s operating income was dragged down by a mix of increased SG&A and R&D and lower added value. Oceaneering International Inc. (NYSE: OII ) has a sizable portfolio weight of 1.74% and has a YTD return of -33.79%. Oceaneering International Inc. just hit a new one-year low on Dec 21st. This came on the heels of Oceaneering International Inc. being downgraded to a Strong Sell by Zacks. In the company’s latest report, Oceaneering International Inc’s reported a 31% decrease in net revenues and an 81% decline in net income. BOTTOM LINE: I still cannot give this ETF my full endorsement as an investment as it is still overly exposed to riskier stocks as shown by the chart comparisons above. In addition, Morningstar rates this fund zero stars and has an F rating by ETF.com. The fund’s high expense ratio of 0.95% is an even bigger turnoff. Editor’s Note: This article discusses one or more securities that do not trade on a major U.S. exchange. Please be aware of the risks associated with these stocks.
Innovation And Scotch Tape

Summary We think too many investors put too much stock into being “first movers.” We use research from HBR to show how calm waters and scotch tape can lay the foundation for solid portfolios. We prefer building a portfolio by investing in companies with large moats using a calm waters approach. In business and economics, a “first-mover advantage” is defined as the benefit accrued to a company whose product is the first to enter a market. These products often create or define an entirely new market opportunity that the world hadn’t known before. Some “first-mover” examples have created very attractive long-duration opportunities. eBAY (NASDAQ: EBAY ), a company we own in our portfolios, was the first online auction service. It has maintained leadership in that area for the last two decades. Kleenex (NYSE: KMB ) was a first mover in the facial tissues market, and has become so common that most people don’t know what a facial tissue is without saying the product name. A prime first-mover example is Coca-Cola (NYSE: KO ), which created the soda pop market in 1896 and continues to dominate it 120 years later. Examples like these give credence to the idea that the early bird indeed catches the worm. The notion has become more powerful as you consider the massive ego and financial benefits of being the next Elon Musk or Jeff Bezos. The possibility of relatively immediate notoriety and wealth has not been lost on private equity investors. It is estimated that private equity firms sit on more than $1.2 trillion of cash that is waiting in the wings to find those kinds of attractive targets. When looking at the cash plus advantage that private equity firms can apply towards deal-making, it has never been higher than today. The private equity deals of today are done at very rich multiples. EBITDA and net income multiples of 6x and 21x higher than the S&P 500 are typical. All this sounds very exciting to us. It brings to mind something Warren Buffett says, “Investors should remember that excitement and expense are their enemies.” At Smead Capital Management, we like companies which have a long history of profitability and strong operating metrics. With very few exceptions, we will not consider a company for which we can’t find at least 7-10 years of history in the public markets. We like businesses that have very wide moats (defensible positions) around their products and services. We like products that are so ubiquitous that they are associated with categories or industries. We think Aflac (NYSE: AFL ), H&R Block (NYSE: HRB ), and Disney (NYSE: DIS ) are nearly inseparable to concepts like supplemental health insurance, taxes, and wholesome family entertainment. Creating brand identity and awareness of this sort translate to very strong and durational business value. We know this sounds substantially more boring than what goes through the blood of those who believe there’s “gold in them thar hills.” There may be gold, but most of the real-world stories told around the campfire of first movers are laden with pain and destruction. After all, was it really helpful to be the first mover in online search (AltaVista / Infoseek), videotape (Betamax), cellular phones (BlackBerry (NASDAQ: BBRY ) / Motorola (NYSE: MSI )), social networking (MySpace), new grocery delivery systems (Webvan), or new and innovative ways of transportation (Segway)? Especially in a world where most innovation efforts are geared towards the technology sector, an area that can be defined by disruptive innovation, we at Smead Capital Management don’t think so. What we find exciting is attempting to understand how our portfolio of companies may be able to leverage brands and products using newer technologies that will extend awareness and increase interaction. What kind of probability can we assign to the success of our companies gaining meaningful leverage from modern-day innovation? A Harvard Business Review article by Fernando Suarez and Gianvito Lanzolla gave us a very helpful framework to think about the concept of technological changes in relation to market development. Suarez and Lanzolla argue that maintaining a long-lasting dominant position is most probable if the market and technological evolution is slow and stable. They use Scotch Tape as an example of “calm waters,” where being first to market has a high likelihood of durability. For calm-water situations, even if technological innovation is attainable, the advantage is not large enough to disrupt or dislocate the core value proposition. The appeal and adoption of calm-water products is also very gradual, giving ample time to organize production, distribution, and branding. Scotch Tape was originally intended for industrial use, and as the product developed just prior to the Great Depression, became widely used by individuals looking to repair household items that might otherwise be discarded. Its parent company, 3M (NYSE: MMM ), had plenty of time to build a strong and wide moat before full market adoption. Nordstrom (NYSE: JWN ) began in 1901 as a humble shoe store, and began selling apparel in the early 1960s. Starbucks (NASDAQ: SBUX ) has been selling an addictive legal drug for over 40 years, and H&R Block began its campaign towards dominating the world of tax services just after WWII. Gannett (NYSE: GCI ) and News Corporation (NASDAQ: NWSA ) operate media franchises whose brands have been around for decades. Experts who are the most excited about the evolution of technology think these brands have far less relevance in an on-demand era driven by digitization. We think these are examples of calm-water situations. The moats are very large, and the products and services have been developed over many years. The possibilities for innovative disruption are real, but in our opinion, far less likely to interrupt the value proposition of the brands themselves. We think we can assign a reasonably high probability of success as these companies utilize innovation to extend brand awareness and reach. Nordstrom’s Direct (online) business has mushroomed from less than $500 million in 2006 to nearly $2 billion last year, but management speaks of this as just one important piece of the company’s larger omni-channel strategy. It’s very complimentary to the core proposition, and greatly leverages what Nordstrom has done extraordinarily well for years. Starbucks has greatly enhanced the experience of its customers through innovation as well. Gannett and News Corporation are dealing with the challenge of applying technology to its core content offerings, causing the stocks to trade at deep discounts to intrinsic value. We believe they are very well positioned to leverage their brands in the digital world. News Corporation, with waterfront property brands like the Wall Street Journal and Barron’s (whose subscriber bases continue to grow), has highlighted the success it is having with digital migration in recent earnings calls. Similarly, we believe the content Gannett provides with its 5,000+ journalists will be relevant for years to come, and is set up to extend the company’s brands digitally. Calm-water situations provide an essential buffer for a company to positively leverage the technological evolution, not be displaced by it. A wide moat affords a company the time necessary to properly assess the best strategy to position itself in new channels and venues. At Smead Capital Management, we don’t expect our companies to win every battle. We are very optimistic about how our companies are positioned to win wars even as evolutionary change presents itself. The information contained in this missive represents SCM’s opinions, and should not be construed as personalized or individualized investment advice. Past performance is no guarantee of future results. Tony Scherrer, CFA, Director of Research, wrote this article. It should not be assumed that investing in any securities mentioned above will or will not be profitable. A list of all recommendations made by Smead Capital Management within the past twelve month period is available upon request.

Best Performing Technology Mutual Funds Of Q1 2015

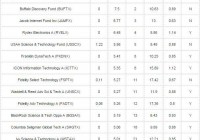
The first quarter earnings numbers for some tech bellwethers have been cheered by market participants. The tech sector is among the sectors to have the best stock price response to Q1 earnings. Nasdaq hit a record high among the flurry of earnings releases. Among the most popular stocks, Apple (NASDAQ: AAPL ) reported strong second-quarter fiscal 2015 results, wherein its earnings jumped 40.4% year over year on higher revenues from iPhone and Mac sales. Meanwhile, upbeat quarterly results from Amazon (NASDAQ: AMZN ) and Microsoft (NASDAQ: MSFT ) also helped the Nasdaq hit a record high. Meanwhile, market participants also saw Google’s (NASDAQ: GOOG ) (NASDAQ: GOOGL ) shares gaining, though it fell short of expectations. However, management was able to explain away its problems by explaining the progress on YouTube that has been an area investors have been concerned about. Separately, eBay (NASDAQ: EBAY ) reported a solid first quarter despite currency headwinds. IBM (NYSE: IBM ) too had reported better-than-expected first quarter 2015 earnings. For the tech mutual funds though, the sector’s gain was restricted to just about 3% in first quarter. This, however, is far above the 0.2% gain in the Technology Select Sector SPDR ETF (NYSEARCA: XLK ) in the first quarter. Returns from the top 15 technology funds in the first quarter are also decently above the sector’s 3% return. The highest return touched 8.6%, while the 15th ranked fund returned 4.1%. The Tech Sector as of May 7 More often than not the technology sector is likely to report above par earnings than other sectors, as the demand for technology and innovation remains high. However, technology stocks are considered to be more volatile than other sector specific stocks in the short run. In order to minimize this short-term volatility, almost all tech funds adopt a growth management style with a focus on strong fundamentals and a relatively higher investment horizon. Investors having an above par appetite for risk and fairly longer investment horizon should park their savings in these funds. On the revenues side, the best growth rate among the 16 Zacks sectors is from the Retail sector – up 11.7% year on year. Medical and Technology have the next best revenue growth rates, up 8.8% and 7.5%, respectively. The Technology sector’s total earnings improved 6.9% on 7.5% higher revenues, with 47.9% of the sector companies beating EPS and 45.8% beating revenue estimates. The sector’s respectable looking growth numbers was largely due to Apple’s strong quarterly report. The Tech Sector: Semiconductor, Cloud Computing The top 15 technology fund performers include funds from varied fund families. Moreover, the list includes funds that focus on varied sectors of the broad technology space. These funds invest in advance science and technology, Internet, and also semiconductor firms. According to the Semiconductor Industry Association (SIA), worldwide semiconductor industry recorded sales growth of 9.9% in 2014 to $335.8 billion. Also, the report indicated worldwide semiconductor sales growth of 3.4% in 2015, followed by 3.1% improvement in 2016. The industry is experiencing growth primarily due to developing end markets and new product offerings, supported by process and yield improvements by semiconductor manufacturers. Separately, the ever evolving technology sector has been witnessing a number of new trends over the past couple of years. Of these, the notable ones include Bring Your Own Device (BYOD), cloud computing, Big Data, Internet of Things (IoT), flash storage, social networking, 3-D printing and wearable devices. These technologies have brought a massive change in the IT storage industry. Last year, we saw mainstream adoption of cloud computing by enterprises. As consumers’ dependence on cloud for storage purpose increases, there will be a proportionate increase in the demand for cloud-dedicated data centers. Widespread implementation of CRM and ERP solutions, increased Internet and mobile penetration, highly growing media and regulatory compliance resulted in data explosion for enterprises. Further, according to research firm Global Industry Analysis Inc. (GIA), information is currently growing at a rate of more than 65% every year with total data generated worldwide anticipated to cross 3 million petabytes by 2020. All these have contributed to the growth of the storage industry. Top 15 Technology Mutual Funds of Q1 2015: In the table below, we present the top 15 Technology mutual funds with the best returns of Q1 2015: Note: The list excludes the same funds with different classes, and institutional funds have been excluded. Funds having minimum initial investment above $5,000 have been excluded. Q1 % Rank vs. Objective* equals the percentage the fund falls among its peers. Here, 1 being the best and 99 being the worst. Only two of the funds here, Firsthand Technology Opportunities (MUTF: TEFQX ) and Ivy Science & Technology Fund A (MUTF: WSTAX ) carry unfavorable Zacks Mutual Fund Ranks. Nine of the funds are favorably placed, with Buffalo Discovery Fund (MUTF: BUFTX ), USAA Science & Technology Fund (MUTF: USSCX ), Fidelity Select Technology (MUTF: FSPTX ) and Columbia Seligman Global Technology Fund A (MUTF: SHGTX ) carrying a Zacks Mutual Fund Rank #1 (Strong Buy). Separately, Franklin DynaTech Fund A (MUTF: FKDNX ), Fidelity Advisor Technology Fund A (MUTF: FADTX ), BlackRock Science & Technology Opportunities Portfolio A (MUTF: BGSAX ), Matthews Asia Science & Technology Fund Inv (MUTF: MATFX ) and T. Rowe Price Global Technology (MUTF: PRGTX ) carry a Zacks Mutual Fund Rank #2 (Buy). T. Rowe Price Global Technology has carried on the strong run in 2014 and over recent years. Its 3- and 5-year annualized returns now stand at 23.5% and 20.8%. Earlier this year, T. Rowe Price Global Technology was also suggested as one of the three funds that investors may buy for 2015. Original Post