Tag Archives: setpageviewname

Black Hills’ SourceGas Acquisition Provides Patient Investors Good Entry Point For Current Income

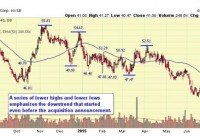
Summary Black Hills recently announced the acquisition of privately-owned SourceGas. The company is financing most of the acquisition by taking on additional debt. The market is punishing the company for the acquisition. The stock dropped 14% over the two weeks following the announcement. I believe the stock will decline further, but this will provide investors looking for current income a good entry point. On July 12th, Black Hills Corporation (NYSE: BKH ) announced the acquisition of SourceGas Holdings LLC from investment funds managed by Alinda Capital Partners and GE Energy Financial Services. David Butler has a nice article on the acquisition , and I’ve written previously about Black Hills Corporation’s business and dividend growth history. The acquisition increases Black Hills’ coverage in its existing service area in Colorado, Nebraska and Wyoming, and expands the company’s service area into Arkansas. The combined company’s customer base will expand by 55% to more than 1.2 million, and Black Hills claims the purchase will “meaningfully” increase earnings in the first year after closing the acquisition. Unfortunately, the company was not more specific as to how large of an earnings increase it expects. Market Sells Stock on Announcement Despite the benefits of the acquisition, the market did not react well to the news. BKH stock fell 2.4% the day after the acquisition and kept going, losing over 14% over the next two weeks. (See chart 1 below.) I believe the reaction is due to the large amount of debt that Black Hills will take on for this acquisition. While Black Hills has shown the ability to integrate acquisitions into their business, many of the past acquisitions have been less than $100 million. The SourceGas acquisition is twice as large as the $940 million acquisition of five Aquila utilities in July 2008. The bulk of the $1.89 billion cost of SourceGas will be a combination of the assumption of $720 million in SourceGas debt and an additional $450 million-$550 million in debt, which will increase Black Hills’ long-term debt by 80% to $2.76 billion. According to Bloomberg , Fitch Ratings placed Black Hills on credit watch negative due to the “material increase” in debt. Will the New Debt Impact the Dividend? I don’t expect Black Hills to stop growing its dividend. The company has increased dividends for an impressive 44 years and it isn’t likely to break this streak despite the debt burden. However, the increase in debt will limit the available funds for dividend growth. With a 55% increase in its customer base, the company should see an earnings increase from the acquisition, but will likely need to work off at least some of the new debt over time to see the full effects of the earnings growth. Over the last 5 and 10 years, Black Hills has compounded the dividend at a slow 2.4%. From 1998-2014, Black Hills increased its quarterly dividend by less than a penny a share. In 2015, the company increased the quarterly dividend by a larger-than-normal 1.5 cents. It would be difficult for the company to slow the dividend even further, but I believe that is exactly what the company will do. Until Black Hills works off the debt from this acquisition, I expect quarterly dividend growth of no more than half a cent a year. What this means for investors is that Black Hills will remain an investment for people looking for current income and not for dividend growth. Wait for BKH to Hit Support Before Buying A technical analysis of the stock movement shows that BKH was in a downtrend even before the merger announcement; the announcement only accelerated the downtrend. As shown in chart 1 below, the stock had set up a pattern of lower highs and lower lows. While the stock may currently be oversold, there is little support until $33, with stronger support at the prior consolidation around $28-$31. (See chart 2.) I think it’s likely that BKH will move to that support zone, which would give the stock a yield of 4.9%-5.2% (based on a stock price of $30-$33). I would consider selling a put or purchasing BKH outright at those levels. (click to enlarge) Chart 1: BKH was in a downtrend prior to the acquisition announcement. (click to enlarge) Chart 2: After breaking into the low $40s on heavy volume, the next major level of support is in the high $20s-low $30s. Source: Stockcharts.com The Bottom Line: The acquisition of SourceGas sets Black Hills up for future growth, but the debt overhang will limit near-term dividend growth. The market’s (over)reaction will provide investors looking for current income a good entry point as the stock moves to support. Disclosure: I/we have no positions in any stocks mentioned, but may initiate a long position in BKH over the next 72 hours. (More…) I wrote this article myself, and it expresses my own opinions. I am not receiving compensation for it (other than from Seeking Alpha). I have no business relationship with any company whose stock is mentioned in this article. Additional disclosure: As noted above, I may take a position in BKH in the near future.
Vanguard Wellesley Income Fund: The Reverse Of Wellington

Having written about VWELX, a reader asked my take on sister fund VWINX. The two are pretty much the reverse of each other. That, in the end, winds up being a risk issue for potential investors. A lot of investors look at bonds as a way to generate income. And that’s true. But in an asset allocation model, they are also a way to provide diversification and stability. In other words, a big part of owning bonds is safety. And that’s where a comparison of value-focused Vanguard Wellesley Income Fund (MUTF: VWINX ) and Vanguard Wellington Fund (MUTF: VWELX ) leads to some interesting findings. One down, now for number two I recently wrote an article about Vanguard Wellington . Within the comments, a reader asked if I would also take a look at sister fund Vanguard Wellesley. The comparison of the two is actually pretty interesting and highlights an important aspect of investing: risk. Wellington’s portfolio goal is to actively invest in stocks and bonds with a mix of roughly two-third stocks and one-third bonds. There’s a band around those percentages since it’s an actively managed fund, but it generally keeps pretty close to its goals. Sister fund Wellesley’s goal is the mirror image, one-third in stocks and two-thirds in bonds. And what that means for performance is very important. For example, as you might expect, Wellington outperforms bond-heavy Wellesley over the trailing one-, three-, five-, 10-, and 15-year periods through June on an annualized total return basis. That said, over the longer periods, the numbers start to get pretty close. There’s just 30 basis points or so separating the two funds over the 15-year period and around one percentage point over the trailing decade. But, the trend is intact, the fund with more stocks does, indeed, do better on an absolute basis. Interestingly, the income both funds generate is pretty close, too. Wellesley’s trailing 12-month yield is a touch under 3%. Wellington’s yield is roughly 2.5%. To be fair, a good portion of that has to do with the current low rate environment. In a different period, with higher interest rates, I would expect Wellesley’s yield advantage to be larger. But what about risk? But return and distributions aren’t the only factors to consider. Bonds are also about risk control. And on that score, these two funds have very different profiles. For example, over the trailing three years, Wellington’s standard deviation, a measure of volatility, is around 5.5. That’s a pretty low standard deviation. However, Wellesley’s number is an even lower 4. For most conservative investors, either of those two figures would be agreeable. Looking out over longer periods starts to show a bigger gap. For example, over the trailing 15-year period, Wellesley’s standard deviation is roughly 6 and Wellington’s is around 9.5. That’s a more meaningful difference. And remember that the two funds had very similar performance numbers over that span. Thus, over the trailing three years, Wellington’s Sharpe ratio of 2, a figure that measures the amount of return relative to the amount of risk taken, outdistances Wellesley’s 1.7. But over the trailing 15 years, those numbers flip, with Wellesley’s Sharpe ratio of 1 outdistancing Wellington’s 0.7 or so. Since performance over that longer term is so close, the big reason for the difference here is risk. Who’s right for what? At the end of the day, the two funds are both good options for conservative investors looking for a balanced fund. The biggest difference is really in the investor’s desire for safety. If the higher bond component in Wellesley will help you sleep better at night, then you should probably go with the more conservative of these two funds. If you don’t find solace in having more bonds in your portfolio, go with Wellington – noting that the choice is likely to lead to a slightly higher risk profile. That said, there’s a caveat. Interest rates are at historic lows. Bond prices and interest rates move in opposite directions. So when rates go down, bond prices go up. That’s been a tailwind for Wellesley for quite some time. If rates start to move higher quickly, however, that could turn into a headwind because as rates go up, bond prices go down. Wellesley’s higher debt component will mean rising rates are a bigger issue for the fund than for its sibling. However, both funds are run by the same management company and have been around a long time. They have dealt with shifting interest rates before. So this is something to keep in mind, but I wouldn’t let it deter me from purchasing either of these two well-run funds if my goal was to own them for a long time. Disclosure: I/we have no positions in any stocks mentioned, and no plans to initiate any positions within the next 72 hours. (More…) I wrote this article myself, and it expresses my own opinions. I am not receiving compensation for it (other than from Seeking Alpha). I have no business relationship with any company whose stock is mentioned in this article.

Value Or Momentum? Try Both

Let’s go back in time 30 years. Remember those “Taste great/less filling” Miller Lite beer commercials from the mid-1980s? You could roughly divide the world’s beer-drinking population into two rival factions: Those that insisted that Miller Lite tasted great… and those that insisted it was less filling. I believe many men lost their lives fighting over this in bars. And I suppose as far as causes go, it’s as good of a cause as any to die for. I consider Miller Lite to neither taste particularly great nor be particularly easy on my stomach. As a native Texan, my heart will always belong to Shiner Bock. But I digress. We’re not here today to discuss beer dogmatism but the far more practical world of investing. As with Miller Lite fans, you can roughly divide the investing world into two camps: Those who favor value strategies and those that favor momentum strategies. Both camps will insist that the academic research – and real world experience – prove that “their way” beats the market over time. And both camps are absolutely right. Simple value screens like Joel Greenblatt ‘s ” Magic Formula ” have beaten the market by a wide margin, and research has shown that a strategy of screening stocks based on simple momentum criteria also beats the market over time. So if value works… and momentum works… what would it look like if we combined the two? Pretty good, actually. Quant guru Patrick O’Shaughnessy wrote an excellent piece last year in which he parses the universe of stocks into value and momentum buckets. Take a look at the following table, taken from O’Shaughnessy’s article. (click to enlarge) The bottom row of the table represents the top 20% of all stocks by momentum. The returns get gradually better as you move down the value scale. In other words, momentum stocks that are cheap outperform momentum stocks that are expensive. And it’s not by a small margin. The cheapest high-momentum stocks returned 18.5% per year, whereas the most expensive high-momentum stocks returned 11.6%. And viewing it through a value lens tells the same story. The right-most column represents the cheapest stocks in the sample using a composite of value metrics. All value-stock buckets performed well. But as you move down the column, the returns get a lot better. In other words, cheap stocks that have recently shown momentum perform better than cheap stocks that don’t. This is a fancier way of repeating the old trader’s maxim to never try and catch a falling knife. Cheap stocks can always get cheaper. What should we take away from this? Value investing works. Momentum investing works. And combining value and momentum works best of all. This article first appeared on Sizemore Insights as Value or Momentum? Try Both. Disclaimer: This site is for informational purposes only and should not be considered specific investment advice or as a solicitation to buy or sell any securities. Sizemore Capital personnel and clients will often have an interest in the securities mentioned. There is risk in any investment in traded securities, and all Sizemore Capital investment strategies have the possibility of loss. Past performance is no guarantee of future results. Original Post