Tag Archives: setpageviewname

Bulls Weigh On Gold As Losses Mount In NUGT

The Direxion Daily Gold Miners Bull 3x Shares ETF (NYSEARCA: NUGT ) shares were down yet again on Friday morning after a day of huge losses on Thursday. Most of Wall Street has turned its back on gold as the U.S. heads toward a rate rise later on in 2015, and the risk of both inflation and deflation melt away. We’ve seen a wide range of negative outlooks on gold since the fall in the price of the metal began earlier in July. The bulls have, for the most part, stayed out of the limelight. There’s good reason for that. Most of those who are bulls now were bulls three months ago, and they’ve been proven wrong. Right now most are trying to rework their models or abandon gold altogether. Here’s what some of them are saying. Stepping back, doubling down, and staying quiet An old adage says to buy into gold as soon as the last bull has left town. We’re not sure if that’s true just yet, but it’s clear that many former gold bugs have left their positions and are trying to recover losses in the market. Jonathan Barratt, chief investment officer at Ayers Alliance has long been happy to put money in gold, but he’s turning against the metal right now. “From a technical perspective,” he told CNBC, “it doesn’t look hot.” He said that the price of the metal has “broken through some very critical areas.” On the other hand, some observers are doubling down on the metal. In a report published on July 3, Bank of America Merril Lynch forecasted that gold prices would rise to $1,300 in 2016 . “We are on the cusp of a bull market,” reads the report. The investment house says that “gold can be supported even if the U.S. central bank turns less accommodative, as long as the Fed just normalizes monetary policy.” John Paulson and David Einhorn, two hedge fund managers known for their bets on gold , will have to disclose their positions in ETFs and miners of the metal next month. The final date for 13F filings is on August 14. Then, or perhaps the day before, we’ll be able to see if gold’s big hedge fund fans are still backing the metal. Gold ETFs remain a danger Leveraged ETFs carry risks that don’t exist in pure metal trading. That’s why NUGT has lost more than 70 percent of its value in the last three months. There are very few outspoken Wall Street voices who will advise a bet on the ETF as a result. Leverage is dangerous, and it’s not for the faint of heart. The NUGT ETF tracks an index of gold mining shares and seeks to deliver returns of three times those on the index. The price of NUGT has become very separate from the price of gold as a metal in recent weeks as a result. Even gold bulls aren’t likely to advise a bet on the ETF. The risks are simply too great for all but the most thrill-seeking of traders. There’s no outspoken bulls of the index in the limelight, and there isn’t likely to be, at least until the price of gold turns around.
RHS – A Defensive ETF Rises

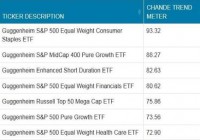
Summary Are these the worst of times? A worried market plays defense. Defensive sectors related to the consumer have risen to the top, such as the RHS ETF. Even though U.S. GDP data have picked up, until earnings improve, defensive sectors will have their day. Introduction When large institutions circle the wagons, they buy consumer staples, because we must spend on food, household cleaning products, over-the-counter medicines and feed that nicotine habit even in the worst of times. The Guggenheim S&P Equal Weight Consumer Staples ETF (NYSEARCA: RHS ) has risen to the top of our rankings of Guggenheim funds (see Figure 1). What does this mean? (click to enlarge) Figure 1: Strongest Guggenheim ETFs (data courtesy ETFmeter.com ) The RHS ETF Holdings. The Guggenheim RHS ETF has 37 stocks, with “equal” weights. The typical weight is around 2.7%, though some are as high as 3.05 percent. Approximately 37% represent Food Products, 21% represent Beverages, 19% represent Food and Staples Retailing, 10% represent Household Products and 8% represent tobacco. The top five best trending stocks in RHS are Mondelez International (NASDAQ: MDLZ ), Brown-Forman (NYSE: BF.B ), CVS Caremark (NYSE: CVS ), Kimberly Clark (NYSE: KMB ) and Monster Beverage (NASDAQ: MNST ). About half of the stocks are rising strongly. The five weakest stocks, and therefore, stocks representing best “value” are Keurig Green Mountain (NASDAQ: GMCR ), Mead Johnson (NYSE: MJN ), WalMart (NYSE: WMT ), Sysco (NYSE: SYY ) and Whole Foods Markets (NASDAQ: WFM ). Consumer Staples: The Strongest Sector within S&P 500 We analyze the major sub-sectors within the S&P 500 index over the medium-term, and find that Consumer related sectors are at the top of the trend strength, with materials and energy at the bottom. The latter have suffered due to a stronger dollar and weakness in China. Figure 2: A summary of medium-term trend analysis of S&P 500 sectors (data courtesy etfmeter.com ). S&P 500 Earnings Forecasts Come Down and Valuations Rise In their analysis of the latest reported Q2 earnings by S&P 500 companies (see Reference 1 below), Zacks reports overwhelmingly, companies have been “guiding down” on Q3 and Q4 earnings for 2015. They estimate that the guidance is for -4% year-over-year earnings decline for Q3 earnings, and a -0.8% decline in Q4 year-over-year earnings growth. This could explain the rise in defensive stocks. In other earnings news, FactSet.com report (see Reference 2 below) that the 12-month forward P/E ratio for the S&P 500 index is 16.7 per their estimates, above the 5-year and 10-year averages. Both data services expect growth to resume in 2016. However, for the rest of the year, valuations are richer than long-term trends, and earnings are expected to be lower, year-over-year. Putting the two together, the defensive posture by large investors seems justified. U.S. Economic Activity has picked up U.S. GDP data have been revised substantially in the latest releases complicating the interpretation of trends (see Reference 3 below). However, the Chicago Fed NAI shows the economy gaining strength (see Figure 3 and Reference 4 below). (click to enlarge) Figure 3: The Chicago Fed National Activity index recast in an investor-friendly format shows the economy bouncing back in Q2. The data are supportive of higher equity prices over the long-term (data courtesy ETFmeter.com ). Looking Ahead The rise in Consumer Defensive sectors reflects the uncertainty about future earnings in 2015. The economy has begun to pick up, but there is always a lag before the improvement shows up in earnings. The recent weakness in China, coupled with the knock-on effects from the Greek rebellion in Europe and a strengthening dollar (in anticipation of an interest rate hike in the U.S.) have lowered earnings guidance. Till the two opposing forces are of roughly equal strength, perhaps into 2016, consumer related stocks are likely to maintain their recent strength. References Sheraz Mian of Zacks: ” Q2 Earnings Season: All Around Weakness – Earnings Trends ” FactSet Earnings Insight ( July 24, 2015 ) Steve Liesman: ” U.S. Government revised earlier GDPs to fix anomalies in reporting ” Tushar Chande, ” SPY, QQQ, IWM: Full Trend Analysis of Major Market ETFs ” Disclosure: I/we have no positions in any stocks mentioned, and no plans to initiate any positions within the next 72 hours. (More…) I wrote this article myself, and it expresses my own opinions. I am not receiving compensation for it. I have no business relationship with any company whose stock is mentioned in this article.

Concentration Consternation

By Chris Bennett “There are 3 kinds of lies: lies, damned lies, and statistics.”- Mark Twain Earlier this week, The Wall Street Journal pointed out that a mere six stocks (Amazon (AMNZ), Google (NASDAQ: GOOG ), Apple (NASDAQ: AAPL ), Facebook (NASDAQ: FB ), Gilead, and Disney) had accounted for more than 100% of the S&P 500’s year-to-date gains. This degree of concentration (reminding some of the peak of the 1990s’ technology bubble) is said to raise “concerns about the health of the market’s advance.” While the article’s arithmetic was correct, its concerns may be misplaced . We don’t have to look back to the tech bubble to see a similar concentration of index returns: During 2011, 4 stocks (Exxon, Apple, IBM, and Pfizer) accounted for more than 100% of the total return of the S&P 500. This did not “presage a pullback,” however, as the S&P 500 followed with 3 straight years of double-digit gains . What was similar about 2011 and 2015 through July 27 (the date of the Journal ‘s analysis)? Aggregate returns were de minimis . In 2011, the S&P 500 gained 2% on a total return basis (and was flat on a price return basis). The total return of the S&P 500 in 2015 was less than 2% through July 27. In both periods, the return of the index was relatively low, making it easy for a small group of strong stocks to account for more than 100% of total performance. Following a few positive trading days, incidentally, “The Only Six Stocks That Matter” now account for only half of the S&P 500’s year to date total return. As of July 29, it would take 22 stocks to account for 100% of the market’s return. Just as the concentration of performance doesn’t lead to reliable conclusions about the market’s future absolute return, it also tells us little about the relative performance of active managers vs. their passive benchmarks. Active managers tend to underperform both when index returns are heavily concentrated among a few stocks and when returns are more widely distributed. In 2011, when four stocks accounted for 100% of the market’s return, 81% of large cap U.S. funds lagged the S&P 500 . 2014 was quite a different year in terms of returns and individual stock contributions to index returns: the S&P 500 ended the year up 14% and it required 176 stocks to account for the market’s total return. Yet active managers did not prosper in these conditions either, as 86% of large cap funds failed to outperform the S&P 500. While it makes for an exciting headline, concentration is no cause for consternation . Disclosure: © S&P Dow Jones Indices LLC 2015. Indexology® is a trademark of S&P Dow Jones Indices LLC (SPDJI). S&P® is a trademark of Standard & Poor’s Financial Services LLC and Dow Jones® is a trademark of Dow Jones Trademark Holdings LLC, and those marks have been licensed to S&P DJI. This material is reproduced with the prior written consent of S&P DJI. For more information on S&P DJI and to see our full disclaimer, visit www.spdji.com/terms-of-use .