Tag Archives: setpageviewname

Volume Is Usually Low At Turning Points

A few days ago, I was trying to buy a little bit of a defense company that I own for myself and clients. It was relatively inexpensive, and had fallen out of favor. Now, it’s not the most liquid beastie on the US market, so I put in an order to buy 2,000 shares, while showing 100 shares, offering to buy at the current bid of $25.50 while allowing purchases at up to $25.57, while the ask was at $25.65. I then shifted away from my trading application, and went to do other work. After an hour, I went back to my trading screen, and saw that 1,200 shares had executed between $25.50 and $25.57, but now the price was much higher, and by the end of the day, higher still. It is even higher now. At the time, I took a look, and lo and behold: I got the bottom tick – the lowest price on that stock ever (for now). I also noted that I had almost all of the volume when it went down to the low price. But 1,200 shares is small compared to the total trading in the name, and $30,000 is also a small amount of money. I concluded that it was a happy accident that I got the bottom tick. I’ve had the same experience working at a hedge fund. I would occasionally get the bottom tick when buying, or the top tick when selling, and most of the time I ended up saying that it had to happen to someone – it was us that day. That said, the total amount of volume was almost always low near the top or bottom, so getting that versus a trade nearby was not worth that much. To have a lot of volume near a top or bottom, you need two or more determined and anxious traders with large capacity to trade, a need for speed, and opposite opinions. That happens sometimes, but in experience, not that often. Near a peak, you would need a buyer anxious to buy a lot more NOW. Near a trough, a seller wanting to sell it all NOW. Most of the time, large institutional investors are cautious, and try to minimize their impact on market prices – being too aggressive will likely give them a worse result than being patient. The exception would be someone who thinks he knows a lot more than the market, but feels that edge will erode soon, and therefore has to do the trade in full NOW. That doesn’t happen often. Practically, that means to not be so picky about levels in buying and selling. If you are getting the trade off and there is decent volume at a price near where you want to do the trade, do the trade, and don’t worry much about the small amount of profit that you might be giving up. Better to focus on ideas that you think have long-term potential for profit, than to waste time trying to squeeze the last bit of profit out of a trade where incremental returns will be minuscule. Disclosure: None

Let Them Eat Spreadsheets

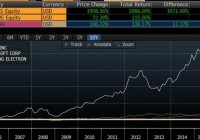
Summary Numbers by themselves don’t tell us very much. Put another way, a text without a context can become a pretext. Because we don’t let sports teams make up their own rules as they play, we have certain standards that companies are supposed to go by when they report their earnings. Accounting isn’t “Calvinball.” By looking carefully at supporting ratios, and how they change over time, a careful analyst can sometimes sniff out whether a company’s earnings are real, or whether they’ve been enhanced by questionable accounting practices. Because financials are like a bathing suit: what they reveal is interesting, but what they conceal may be even more interesting. What good are financial statements? Most of us have a vague idea that Apple (NASDAQ: AAPL ) makes iPhones, that Panera (NASDAQ: PNRA ) runs restaurants, and that Wal-Mart (NYSE: WMT ) sells stuff. But how well do they do these things? Reports that Amazon (NASDAQ: AMZN ) earned 19 cents last quarter or that IBM (NYSE: IBM ) had sales of $20.8 billion leave us cold. Numbers by themselves don’t tell us very much. Put another way, a text without a context can become a pretext. Financial statements are intended to tell us what a company has (the balance sheet) and what the firm did with what it has (the income statement). They also disclose what management has done with its cash (the statement of cash flows). We need to know these things because ultimately any investment’s value is determined by how much cash it can generate for its investors, and how predictable (or unpredictable) this cash stream is. Because we don’t let sports teams make up their own rules as they play, we have certain standards that companies are supposed to go by when they report their earnings. Accounting isn’t ” Calvinball .” But electric utilities are different than banks, which differ from defense contractors. So management is allowed a little leeway as they apply the rules. Those choices, however, have to be reflected in the footnotes – usually “Footnote 1.” In order to make sense of the raw numbers, equity analysts use ratios to compare companies with each other. It’s notable that Apple had a 40% profit margin the last year, but that’s even more remarkable when you see that Microsoft’s (NASDAQ: MSFT ) margin was only 23%, and that Samsung’s ( OTC:SSNLF ) was just 10%. That may be one reason why Apple seems to be taking over the world. Source: Bloomberg Every year public companies have to hire outside accountants to examine their financial statements and verify that they’ve been playing by the rules. Although the financial news tends to report just one or two numbers each quarter – earnings per share and sales – there are lots and lots (and lots) of supporting statements that go into those. Businesses can be complicated, and disclosing their activities properly takes a lot of time and effort. Last year, GE’s (NYSE: GE ) annual financial statement was 247 pages long! By looking carefully at these supporting ratios, and how they change over time, a careful analyst can sometimes sniff out whether a company’s earnings are real, or whether they’ve been enhanced by questionable accounting practices. Because financials are like a bathing suit: what they reveal is interesting, but what they conceal may be even more interesting. Editor’s Note: This article discusses one or more securities that do not trade on a major U.S. exchange. Please be aware of the risks associated with these stocks. Share this article with a colleague

Beware Of Screens

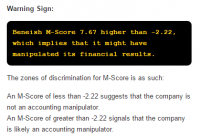
Summary When doing work on IBM recently, we came upon a significant mistake made by one of our data providers. Had we acted on this result without doing due diligence, we would have missed what we consider a profitable trade at best or lost money on puts at worst. Screens represent a general problem: a preponderance of data and a dearth of insight. Use screens as a starting point only. They should be your first tool, not only tool. Investors face a host of risks that they willingly take on. There’s the biggest risk (risk of overpaying), sentiment risk, market obsolescence, risks flowing from the capital structure etc. One of the risks that’s talked about less often is what we call “the input risk”. We know of a few horror stories where people invested based entirely on web based screens and have come to regret it. In this short piece, we want to offer a specific example of why this is such a risk and make a general point about how investors should use these valuable, but limited tools. The advice seems simple, but like a great deal of simple advice, it’s followed infrequently by some. This may be unwelcome news to some people who prefer the magic bullet solution to a systemic problem: doing well at this requires a great deal more work than running a screen. We only publish a portion (sometimes a small portion) of the work we do when analysing a company. There’s actually a great deal going on below the surface here. There are two reasons for keeping most of our work to ourselves. First, we offer it to paying clients. It’s only fair. They paid for it. Second, we believe the wider readership would rather not be subjected to even longer screeds about a given name than we normally impose upon them. For instance, we like to focus on what the sales community (sorry…the ” analyst ” community…) is saying about a particular name, since they often act as a long-run contra indicator. We also like to review the likelihood that a given company is a financial manipulator. We do this in a variety of ways and for obvious reasons. For anyone who’s interested, feel free to on one of the methods we use, developed by professor Messod Beneish . One Example Of How Things Could Have Gone Badly When we started our analysis of IBM (NYSE: IBM ) recently , we started by reviewing a financial website (Gurufocus). Gurufocus is one of our favourite go-to sites and is often very useful, but when it’s mistaken it’s really mistaken. In particular, the site claimed that there was a better than average chance that IBM was a financial manipulator, based on its M-score. When we calculated the score ourselves, we determined that IBM is no more likely to have failed Beneish’s manipulator screen than any other company. Gurufocus responded to our query by saying that it relies on financial results posted by Morningstar, so we should approach that organisation. This is strange because the Morningstar numbers and the Gurufocus numbers don’t agree across the board. In this instance, Gurufocus/Morningstar didn’t include one of the components of IBM’s accounts receivable in March 2014, making it look as though the company’s accounts receivables have ballooned massively over the past four quarters. For the record, when accounts receivables grow massively and rapidly, that’s a huge red flag. The fact is that this didn’t happen at IBM, so that company was unfairly painted with the “manipulator” brush. Source: Gurufocus, July 28, 2015 The actual results are these: Source: Company filings The actual M-Score for IBM is ~-3, which means that it does not fail the screen developed by professor Beneish. If the reader is interested in learning more about the M-Score and professor Beneish’s methodology, feel free to check out some earlier work or have a look at some online resources . If we simply placed a trade based Gurufocus’ findings, we believe we would have injured ourselves and our clients over the coming year. We would have either not bought a company that we’re actually generally bullish on, or we would have lost money on puts. If we didn’t discover the problem with the way accounts receivable was being calculated, we could have come to a faulty conclusion. There’s a lesson about double checking screens here. Conclusion This isn’t to say that such services are not valuable. Sites like Gurufocus and YCharts and others improve productivity tremendously. They help investors search the universe of stocks in seconds. The problem is that if you make investment decisions based on their results alone, you’re taking on unnecessary risk. The proliferation of sites that allow us to aggregate the vast amounts of data available is both a symptom and a cause of the preponderance of data and a (relative) dearth of insight. When starting to invest, we recommend using sites like these as a starting place, and when you find something interesting, immediately go to the actual sources. The fact that so many investors seem frightened of financial statements and their accompanying notes leads us to believe that there’s potential profit to be had if you train yourself accordingly. We’re reminded of how Jim Chanos spotted the Enron debacle first because so few other analysts read the notes to the financial statements published by that company . The SEC website is as available as any other and it should be the place you visit just after hearing about a company through one of the available tools. These screens are great as a first but not final tool. Disclosure: I/we have no positions in any stocks mentioned, and no plans to initiate any positions within the next 72 hours. (More…) I wrote this article myself, and it expresses my own opinions. I am not receiving compensation for it (other than from Seeking Alpha). I have no business relationship with any company whose stock is mentioned in this article.