5 Ways To Beat The Market: Part 4 Revisited
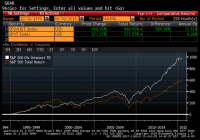
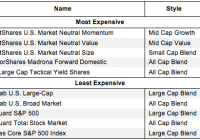
Summary •In a series of articles in December 2014, I highlighted five buy-and-hold strategies that have historically outperformed the S&P 500 (SPY). •Stock ownership by U.S. households is low and falling even as the barriers to entering the market have been greatly reduced. •Investors should understand simple and easy to implement strategies that have been shown to outperform the market over long time intervals. •The fourth of five strategies I will revisit in this series of articles is consistent dividend growth investing which has seen these stocks produce higher risk-adjusted returns over time. In a series of articles in December 2014, I demonstrated five buy-and-hold strategies – size, value, low volatility, dividend growth, and equal weighting, that have historically outperformed the S&P 500 (NYSEARCA: SPY ). I covered an update to the size factor published on Wednesday, posted an update to the value factor on Thursday, and published an update on the low volatility anomlay on Friday. In that series, I demonstrated that while technological barriers and costs to market access have been falling, the number of households that own stocks in non-retirement accounts has been falling as well. Less that 14% of U.S. households directly own stocks, which is less than half of the amount of households that own dogs or cats , and less than half of the proportion of households that own guns . The percentage of households that directly own stocks is even less than the percentage of households that have Netflix or Hulu . The strategies I discussed in this series are low cost ways of getting broadly diversified domestic equity exposure with factor tilts that have generated long-run structural alpha. I want to keep these investor topics in front of the Seeking Alpha readership, so I will re-visit these principles with a discussion of the first half 2015 returns of these strategies in a series of five articles over five business days. Reprisals of these articles will allow me to continually update the long-run returns of these strategies for the readership. Dividend Aristocrats While people can complicate investing in a myriad of ways, only two characteristics ultimately matter – risk and return. My personal and professional investing revolves around the simple maxim of trying to earn incremental returns for the same or less risk. The strategy highlighted below has accomplished this feat over long time horizons, and is easily replicable in financial markets. In addition to the bellwether S&P 500, Standard and Poor’s produces the S&P 500 Dividend Aristocrats Index . (Please see linked microsite for more information.) This index, which is replicated by the ProShares S&P 500 Dividend Aristocrats ETF (NYSEARCA: NOBL ), measures the performance of equal weighted holdings of S&P 500 constituents that have followed a policy of increasing dividends every year for at least 25 consecutive years. To put this into perspective, the average S&P 500 constituent now stays in the index for an average of only eighteen years , so the list of companies who have had the discipline and financial wherewithal to pay increasing dividends for an even longer period is necessarily short at 52 companies (10.4% of the index). Detailed below is a twenty-year return history for this index relative to the S&P 500. The Dividend Aristocrats have produced higher average annual returns, outperforming the S&P 500 by 2.4% per year. This approach has also produced returns with roughly three-quarters of the risk of the market, as measured by the standard deviation of annual returns as demonstrated in the cumulative return profile graph and annual return series detailed below: (click to enlarge) (click to enlarge) Source: Standard and Poor’s’ Bloomberg Notably, the Dividend Aristocrats outperformed the S&P 500 in every down year for the latter index (see shading above), gleaning part of its outperformance through lower drawdowns in weak market environments. Another notable factor of the dividend strategy is that when it underperformed the S&P 500 by the largest differential (1998, 1999, and 2007) the market was headed towards large overall losses. Maybe then it is a negative sign that the underperformance of the Dividend Aristocrats in the first half of 2015 was its largest since the 2007 top. The Dividend Aristocrats posted their first negative return for a half-year since 2010. Perhaps, this correlation between Dividend Aristocrat underperformance and market tops is spurious and not a leading indicator, but it makes sense that prior to the tech bubble burst in the early 2000s that the Dividend Aristocrats naturally featured less recent start-ups because of the long performance requirements for inclusion. It also makes sense that when markets were heading to new all-time highs in 2007, the market correction in 2008 would be less severe for the high quality constituents in the Dividend Aristocrats index, which have demonstrated the ability to manage through multiple business cycles. I have now dedicated several paragraphs to dividend growth investing in companies with a policy to offer consistent and growing dividends without addressing the elephant in the room. Do dividends matter?! Certainly academics have long contested that dividends should not matter to the value of the firm, and can even be inefficient given shareholder taxation. Absent taxes, investors should be indifferent between a share buyback and a dividend, which are different forms of the same transaction – returning cash to shareholders. Paying dividends when the firm has projects that can earn a return above their cost of capital would lower the value of the firm over time. Merton Miller, Nobel Prize winner and one of the fathers of capital structure theorem, tackled the debate in a 1982 paper entitled ” Do Dividends Really Matter .” My takeaway from his qualitative analysis is that paying consistently rising dividends is a discipline that ensures that the company is appropriately levered and making well planned investment decisions. In Friday’s update article on exploiting the Low Volatility Anomaly , I demonstrated that lower risk stocks have outperformed the broader market and higher risk stocks over the last twenty plus years in markets around the world. The business model of Dividend Aristocrats must be inherently stable and produce continual free cash flow through the business cycle or these companies would not be able to maintain their record of paying increasing dividends for over a quarter century. The return profile of the Dividend Aristocrats is much more correlated to the S&P Low Volatility Index ( SPLV , r= 0.92) than the S&P 500 (r = 0.84 ), which lends credence to the strategy’s low volatility nature and stability through differing market environments. I have chosen to detail the Dividend Aristocrats and Low Volatility stocks separately because I believe part of the strong performance of the Dividend Aristocrats is also attributable to the fifth factor tilt highlighted in my concluding article in this series update to be published tomorrow. Disclaimer: My articles may contain statements and projections that are forward-looking in nature, and therefore inherently subject to numerous risks, uncertainties and assumptions. While my articles focus on generating long-term risk-adjusted returns, investment decisions necessarily involve the risk of loss of principal. Individual investor circumstances vary significantly, and information gleaned from my articles should be applied to your own unique investment situation, objectives, risk tolerance, and investment horizon. Disclosure: I am/we are long NOBL, SPLV, SPY. (More…) I wrote this article myself, and it expresses my own opinions. I am not receiving compensation for it (other than from Seeking Alpha). I have no business relationship with any company whose stock is mentioned in this article.