Tag Archives: setpageviewname

5 Ways To Beat The Market: Part 5 Revisited

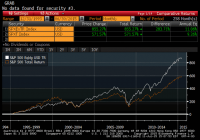
Summary •In a series of articles in December 2014, I highlighted five buy-and-hold strategies that have historically outperformed the S&P 500 (SPY). •Stock ownership by U.S. households is low and falling even as the barriers to entering the market have been greatly reduced. •Investors should understand simple and easy to implement strategies that have been shown to outperform the market over long time intervals. •The final of five strategies I will revisit in this series of articles is equal weighing, a contrarian “buy low, sell high” approach to index rebalancing. In a series of articles in December 2014, I demonstrated five buy-and-hold strategies – size, value, low volatility, dividend growth, and equal weighting, that have historically outperformed the S&P 500 (NYSEARCA: SPY ). I covered an update to the size factor published on Wednesday, posted an update to the value factor on Thursday, covered the Low Volatility Anomaly on Friday, and tackled the Dividend Aristocrats yesterday . In that series, I demonstrated that while technological barriers and costs to market access have been falling, the number of households that own stocks in non-retirement accounts has been falling as well. Less that 14% of U.S. households directly own stocks, which is less than half of the amount of households that own dogs or cats , and less than half of the proportion of households that own guns . The percentage of households that directly own stocks is even less than the percentage of households that have Netflix or Hulu . The strategies I discussed in this series are low cost ways of getting broadly diversified domestic equity exposure with factor tilts that have generated long-run structural alpha. I want to keep these investor topics in front of the Seeking Alpha readership, so I will re-visit these principles with a discussion of the first half returns of these strategies in a series of five articles over the next five days. Reprisals of these articles will allow me to continually update the long-run returns of these strategies for the readership. Equal Weighting The S&P 500 Equal Weight Index is a version of the S&P 500 where the constituents are equal weighted as opposed to the traditional market capitalization weighting of the benchmark gauge. Guggenheim S&P 500 Equal Weight ETF (NYSEARCA: RSP ) replicates this alternative weight index. When the equal-weighted version of the index is rebalanced quarterly to return to equal weights, constituents which have underperformed are purchased and constituents which have outperformed are reduced, a contrarian strategy that has produced excess returns relative to the capitalization-weighted S&P 500 index over long-time intervals. Equal-weighting also gives an investor a greater average exposure to smaller capitalization stocks, a risk factor, detailed in the first article in this series , for which investors have historically been compensated with higher average returns. The composition of the equal-weighted index is more consistent with mid-cap stocks, which have historically outperformed large caps. The graph below shows the cumulative return of the S&P 500 Equal Weight Index relative to the cumulative return of the capitalization-weighted S&P 500 Index. (click to enlarge) Research by Plyakha, Uppal, and Vilkov (2012) puts some data behind my narrative that the size factor and contrarian rebalancing drive alpha in equal weighting strategies. Their analysis found that the higher systematic return of equal weighting relative to capitalization-weighted portfolios arose from relatively higher exposure to the size and value factors described in the first two articles in this series. The higher alpha of the equal-weighted strategy was determined to arise from periodic rebalancing, a contrarian strategy that exploits time-series properties of stock returns. The S&P 500 currently has a 17.1% weighting towards its ten largest constituents. Over one-sixth of the value of the broad market gauge is attributable to one-fiftieth of its components. To demonstrate the value of the size factor to equal-weighting, we should see the S&P 500 outperform the S&P 100 over the same twenty-year time interval. The S&P 100 Index, the hundred largest constituents of the S&P 500, trailing the S&P 500 by 11bps per year. If the contrarian rebalancing in equal-weighting also creates alpha, we should see an equal-weighted S&P 100 outperform a capitalization-weighted S&P 100. While I do not have data on the total return of an equal-weighted S&P 100 Index for 20 years, I do have fourteen years of data that show that an equal weighted index would have outperformed the capitalization-weighted index by 1.77% per year since the beginning of 2001. When I have previously discussed equal-weighting the S&P 500, some readers have commented that this is simply a mid-cap strategy, owing all of its outperformance to the size factor, but I hope this data shows that the contrarian re-balancing is also an important piece of the structural alpha gleaned through equal-weighting. Some of the most powerful ideas in finance are the easiest and simplest to implement. At its core, equal weighting overcomes the bias inherent in the capitalization-weighted benchmark index that forces investors to hold larger proportions of stocks that have risen in value. Periodic rebalancing allows the strategy to “buy low and sell high”, still the most tried and true way of making money in financial markets. Each of the five strategies I have outlined in this series share this notion that sometimes the best ideas are the simplest. I hope long-term buy-and-hold investors consider the size, value, low volatility, consistent dividend growth, and equal weighting approaches that have been demonstrated to outperform the market. Each of these factor tilts gleans their outperformance from slightly different risk factors, which should generate risk-adjusted outperformance over multiple business cycles. Low Volatility will have better performance in the down-turn, the size and value factors should generate outperformance in the recovery. I conclude this series of articles with a combined twenty plus year history of their total returns. The mix columns is an equal-weighting of the five different strategies. (You now also know that periodic rebalancing of these different strategies could enhance the alpha generated.) Over twenty-years, these strategies each produced higher absolute returns than the S&P 500 and higher average returns per unit of risk. Combining these strategies would have generated a 2.1% annualized outperformance with less than 90% of the variability of returns. A 2.1% annualized outperformance over this long time frame would have meant that investors who employed these strategies for twenty years would have had nearly a 50% higher nest egg today. (click to enlarge) With the return series side-by-side, readers should notice that Low Volatility stocks and the Dividend Aristocrats outperformed in weak equity years (2000-2002, 2008). Value stocks and small cap stocks have outperformed in the early stages of economic recoveries (2003, 2009). Understanding how these five strategies perform in different parts of the business cycle is a key towards value-accretive asset allocation. Thanks to all of my readers who contributed thoughtful comments on this series. Long-time readers may be surprised that momentum, a topic I have covered in many past articles, did not make it into my five strategies. The paired switching strategies in my momentum articles have also “beat the market”, but did so with a different source of alpha than the “buy and hold” approaches that I wished to spotlight in this series. Future work will follow-up on reader questions emanating from theses articles. Additional articles will also focus on combinations of these strategies that could well serve long-term investors. Disclaimer: My articles may contain statements and projections that are forward-looking in nature, and therefore inherently subject to numerous risks, uncertainties and assumptions. While my articles focus on generating long-term risk-adjusted returns, investment decisions necessarily involve the risk of loss of principal. Individual investor circumstances vary significantly, and information gleaned from my articles should be applied to your own unique investment situation, objectives, risk tolerance, and investment horizon. Disclosure: I am/we are long RSP, SPY. (More…) I wrote this article myself, and it expresses my own opinions. I am not receiving compensation for it (other than from Seeking Alpha). I have no business relationship with any company whose stock is mentioned in this article.
Seeking Alpha Globally

Summary Today, investing ideas outside of the US are underrepresented. Seeking Alpha should adopt a more international focus. Opportunities abound from Russia, to China and South Korea. I love my country. I have had family members fight, bleed, and die in every one of America’s wars since the founding. While I enjoy travelling as much as possible, I am always grateful to come home (okay except from New Zealand, but almost always grateful to come home). StW members come from around the world; so should our investments. As much as I love America, fixating on the US market when it comes to investing can be an expensive mistake. Additionally, since launching Sifting the World , I have gotten to know dozens of members from around the world who would be interested in discussing more international investing ideas. Today Seeking Alpha is US-centric in terms of editorial focus and technological ability to, for example, accept foreign tickers. A more global aperture is one of the exciting new directions that it can grow in under the new leadership . America in Context In terms of the opportunity set, it is worth placing the US in context. It represents about 2% of Earth’s surface area and 7% of its land. We are 5% of the population. The market cap is between a third and a half of the world equity market cap. But the gross domestic product is only about a fifth of the world’s combined GDP. So in terms of the pursuit of investing ideas, it might be reasonable to look for at least half abroad. In fact, it might make sense to go for the 80% that is proportionate to the non-US GDP of the rest of the world. There are opportunities there today. Also, country share of the world GDP is hardly static. So having a geographically diverse portfolio can avoid overweighting dominant markets when they eventually decline, as they all eventually have done in the past. Home Country Bias Investors around the world overweight exposure to companies in their home countries. This lack of diversification is caused in part by the preference to be exposed to the familiar. But investors should try to be rational and the home country bias is ubiquitous but not rational. Like the children in Lake Wobegon, we cannot all be “above average”. This illusory superiority results from a dangerous and expensive cognitive bias. Comparing countries I compare country markets on the basis of economic freedom, corruption, currency, courts, and legal systems. These are the factors that form my basis of an opinion on whether my rights as an investor will be protected. When I invest, I actively engage with boards and managements to ensure that they are maximizing shareholder value. Often, this is a collaborative, mutually beneficial process. Occasionally, it is confrontational and litigious. So, it is important to know ahead of time whether my rights can be enforced. I analyze transparency before fundamentals, because there is little use in finding a bargain if the numbers are false. For example, as recently as 2011, over 60% of my short ideas were Chinese. Had their numbers been real (they were fraudulent), they would have been among my favorite long ideas. But before one valued them, it was worth a deep investigation into the fact that they were lying in their financials and that there was little that an American investor could do about it. Once country markets are weighted by the above attributes, I turn to fundamental valuation metrics. I blend a combination of price relative to earnings, cash flow (with an emphasis on cash flow from operations), book value, and sales. I also look at dividend yield and the cyclically adjusted PE ratio/CAPE. None of these metrics gives me an answer, but a blend gives me a bracket in which to place individual countries. International Opportunities What recent opportunities have arisen? I would start by answering that question by saying that the answer based upon transparency and fundamentals had little overlap with my intuition. One measures in part because intuition is so often faulty. I have shorted equities in countries that I love (I am a lifelong Sinophile with an admiration for Chinese history and culture that surpasses most of my Chinese friends) and bought equities in countries where I have deep reservations (Russia’s government has horribly persecuted friends of mine). I subjected each country around the world to analysis, isolating a number of promising candidates for extra scrutiny. Additionally, I have spent more time on countries with equities at particular bargains. In the course of this analysis, I moved beyond my daily focus on securities in North America ( Canada , a market that I love, being so close and familiar that it hardly feels foreign). Three that particularly stood out were Russia, China, and South Korea. Over the course of the past year, I have dedicated extra research to those three. Russia Russia has been a favorite long idea of mine since last December. My primary tool for implementing this thesis has been shorting the leveraged inverse Russian ETF RUSS . I discussed the idea in December and again in February . To date, it is down over 70% and will probably decline further over time. Specific actionable securities Prospectively, what is the best way to get Russian exposure? My current favorite is EOS Russia (ISIN-code: SE 0002016261). Shares of this fund, which are primarily dedicated to Russian electric distribution, cost 1.4x EV/EBITDA, 1.8x P/E, and 10% of book value. China China has been a favorite short idea of mine since April . I shorted the leveraged ETF, YINN . It has declined by over 30% since then but could fall further as Chinese companies allow halted securities to trade freely. Specific actionable securities In addition to shorting YINN via equity or options, you may consider a long in one of the more promising Chinese ADRs with takeover offers as a YINN hedge. My favorites include Taomee (NYSE: TAOM ) and YY (NASDAQ: YY ). South Korea My favorite country market is South Korea . For Korean exposure without having to pick through individual securities, I have a high level of confidence in Weiss Korea Opportunity Fund ( OTCPK:WISKF ). Specific actionable securities A favorite South Korean equity of mine which might be worth your consideration is Ilsung Pharma (003120). Ilsung is a small but profitable pharma company with a pile of cash and 2% ownership in Samsung C&T (000830 KS). It cost about two-thirds the value of its liquid cash and securities and about half of its book value. It is worth book. Samsung C&T is part of the Samsung chaebol which owns stakes in various businesses, the most valuable of which is Samsung Electronics. The Lee family that controls Samsung is trying to merge Cheil Industries with Samsung C&T. Elliott Associates owns over 7% of Samsung C&T and opposes the deal. The vote is on Friday July 17 and it will be a close one. If it goes through, it will strengthen the hand of heir apparent Lee Jae-yong. Based upon his position as Vice Chairman of Samsung Electronics and his economic stakes in the chaebol’s components, he is likely to emerge as the family leader in the future. Elliott’s concerns appear to be wholly valid. The transaction appears to be a form of self-dealing that massively understates the value of Samsung C&T in absolute terms and relative to Cheil. The key question is whether or not Elliott’s form of activism will work in Korea this time. The vote requires the support of two-thirds of votes cast. The National Pension Service, which owns eleven percent, has dutifully closed ranks in favor of the deal. Elliott will probably need to convince another fifteen percent to vote against the deal in order to block it. As of today, the deal and Samsung generally appear to be firmly in Lee control. But if that changes, there could be additional value for Samsung C&T holders. Whether or not Elliott wins (and I hope that they do as their victory would enrich all fellow Samsung C&T holders and further open up Samsung and Korea generally to shareholder scrutiny), Samsung C&T is quite cheap at a discount to NAV of over 40%. Conclusion We can each be as patriotic about our home as we like, and while it can be a strong feeling, patriotism is an emotion. Investing is about thinking. The marketplace should be a meritocracy in which the best ideas, products, and investments win. To that end, we should constantly search the world for foreign opportunities that are better than what we have at home. Disclosure: I am/we are short YINN. (More…) I wrote this article myself, and it expresses my own opinions. I am not receiving compensation for it (other than from Seeking Alpha). I have no business relationship with any company whose stock is mentioned in this article. Additional disclosure: Chris DeMuth Jr is a portfolio manager at Rangeley Capital. Rangeley invests with a margin of safety by buying securities at deep discounts to their intrinsic value and unlocking that value through corporate events. In order to maximize total returns for our investors, we reserve the right to make investment decisions regarding any security without further notification except where such notification is required by law.
The Natural Gas Market Remains Soft – UNG Is Slightly Down

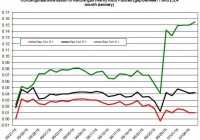
The price of UNG remains low and has declined by 2% since the beginning of the month. The weather is expected to heat up, but only in parts of the U.S. Will this be enough to drive up the demand for natural gas in the power sector? The natural gas market has started to cool down in the past couple of weeks, as the price of the United States Natural Gas ETF (NYSEARCA: UNG ) has declined by 2% since the beginning of the month. However, it’s still early to consider a downward trend in the price of UNG. And the market is still expected to remain soft in the near term, with higher-than-normal injections to storage, normal temperatures, robust production and low demand for natural gas. Unless the weather heats up, the price of UNG isn’t going anywhere. In the futures markets, contango has gone up mostly for the month of November – this is when the demand for natural gas is likely to pick up on account of higher consumption in the residential/commercial sectors (the start of winter). In November, the extraction season is expected to commence. (click to enlarge) (Data Source: EIA) But for the near-term contracts – September and October – contango hasn’t picked up by much, and as such, it’s not likely to have much of an impact on the roll decay of UNG. In the recent EIA weekly update , underground storage rose by 91 Bcf – a bit higher than market expectations, which stood at 86 Bcf. This was also higher than the 5-year average of 75 Bcf. Furthermore, in the coming weeks, analysts still project that the storage will rise at a faster pace than the 5-year average. Despite the higher pace in injections, the price of UNG has rallied in the past few days. Even the modest decline in natural gas consumption – down by 2% week on week, mainly due to lower consumption in the power sector – hasn’t driven down the price of UNG. The weather, which was expected to heat up, didn’t do so. The average temperatures were close to normal levels. Looking forward, the weather forecasts show colder-than-normal temperatures in parts of the west coast and the northeast. And warmer-than-normal weather throughout the south. Nonetheless, the cooling degree days (CDD) are expected to be higher: 19 degrees higher than normal and 27 degrees above 2014 levels. So we have a mixed signal about where the demand for natural gas in the power sector is heading this week. If the weather does turn out to be warmer than normal. The supply continues to slowly pick up, as production is still 5.4% higher than last year. Also, the number of rigs hasn’t changed much in the past few weeks: According to Baker Hughes , as of last week, the number of gas rigs slipped by 2 to 217. So far, this summer hasn’t been too hot. The power sector, which plays a more important role in this time of the year, relative to other sectors, has kept the price of UNG at its current low level. Unless the weather starts to heat up again, the injections will continue to be higher than normal and UNG will remain low. For more please see: ” On the Contango in the Natural Gas Market “. Disclosure: I/we have no positions in any stocks mentioned, and no plans to initiate any positions within the next 72 hours. (More…) I wrote this article myself, and it expresses my own opinions. I am not receiving compensation for it (other than from Seeking Alpha). I have no business relationship with any company whose stock is mentioned in this article.