Tag Archives: setpageviewname

RWX: Not My First Choice For International Real Estate

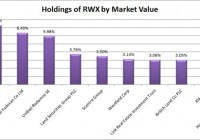
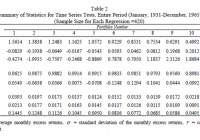
Summary RWX has too much volatility and correlation to the S&P 500. The dividend yields aren’t bad, but they aren’t great enough to justify the investment. The high expense ratio hammers home my view that this just is not an attractive way to do international investing. Investors should be seeking to improve their risk adjusted returns. I’m a big fan of using ETFs to achieve risk adjusted returns relative to the portfolios that normal investors can generate for themselves after trading costs. A substantial portion of my analysis will use modern portfolio theory, so my goal is to find ways to minimize costs while achieving diversification to reduce the total portfolio risk level. In this article, I’m reviewing the SPDR Dow Jones International Real Estate ETF (NYSEARCA: RWX ). What does RWX do? RWX attempts to track the investment results of the Dow Jones Global ex-U.S. Select Real Estate Securities Index. The ETF falls under the category of “Global Real Estate”. Does RWX provide diversification benefits to a portfolio? Each investor may hold a different portfolio, but I use the SPDR S&P 500 Trust ETF (NYSEARCA: SPY ) as the basis for my analysis. I believe SPY, or another large cap U.S. fund with similar properties, represents the reasonable first step for many investors designing an ETF portfolio. Therefore, I start my diversification analysis by seeing how it works with SPY. The correlation is about 84%, which is high enough that RWX does not offer the level of diversification benefits that I would like to see. Standard deviation of monthly returns (dividend adjusted, measured since January 2007) The standard deviation isn’t going to make a strong case for investing in RWX. For the period I’ve chosen, the standard deviation of monthly returns is 142% of the deviation for the S&P 500. Due to the combination of volatility and correlation, it is not viable to use RWX as a way to reduce the portfolio risk if the major holding in the portfolio is SPY or another major domestic equity ETF since most major domestic equity ETFs have extremely high correlations to SPY themselves. I don’t believe historical returns have predictive power for future returns, but I do believe historical values for standard deviation of returns relative to other ETFs have some predictive power on future risks and correlations. Yield The distribution yield is 3.03%. This may be one of the strongest areas for the ETF, but investors can find similar levels of yield on domestic equity REIT ETF investments with lower levels of risk. Expense Ratio The ETF is posting 0.59% for an expense ratio. Since I focus on buying ETFs with expense ratios below 0.10%, the costs on this investment are way above my comfortable threshold. However, the overall international REIT ETF sector has high expense ratios. Market to NAV The ETF is trading at a 0.21% premium to NAV currently. I think any ETF is significantly less attractive when it trades above NAV. The premium to NAV is a little surprising since the trading volume (over 600,000) should be enough to mitigate any meaningful deviation from NAV. On the other hand, when I look at the average monthly premium/discount to NAV, I see that over the last year the ETF has often bounced between trading at premiums and discounts to NAV. The most notable period was October of 2014 when the ETF averaged a premium of nearly 1.5% to book value. Largest Holdings The diversification within the ETF is pretty weak as demonstrated by my chart of the top holdings. (click to enlarge) Despite the large positions in a few of the holdings, doing individual due diligence on each investment would be fairly difficult. Investors buying into the international REIT ETF will need to rely on markets being at least somewhat efficient. Allocation by Country The following chart breaks down the holdings by country. (click to enlarge) When it comes to international diversification, I’m fairly happy with the way the portfolio is set up. For it being a real international fund, I would prefer some exposure to Africa and South America in the portfolio, but on the whole, diversification is fairly solid. It is a pet peeve for me when funds label themselves as international and then put 40% to 70% of the portfolio in a single foreign country. Conclusion In my opinion, it is difficult to make a solid argument for the use of the SPDR Dow Jones International Real Estate ETF under modern portfolio theory. The high level of volatility combined with the high correlation leaves investors requiring a higher expected level of return on the investment. I don’t see that as a likely result when the ETF is charging a high expense ratio. The holdings would have to significantly outperform the S&P 500 over the long term to provide enough returns to compensate investors for the additional risk. On top of the higher level of returns, the ETF also has to be able to cover the higher expense ratios. In short, I’m just not seeing a compelling long-term option for inclusion in my portfolio. Disclosure: I/we have no positions in any stocks mentioned, and no plans to initiate any positions within the next 72 hours. (More…) I wrote this article myself, and it expresses my own opinions. I am not receiving compensation for it (other than from Seeking Alpha). I have no business relationship with any company whose stock is mentioned in this article. Additional disclosure: Information in this article represents the opinion of the analyst. All statements are represented as opinions, rather than facts, and should not be construed as advice to buy or sell a security. Ratings of “outperform” and “underperform” reflect the analyst’s estimation of a divergence between the market value for a security and the price that would be appropriate given the potential for risks and returns relative to other securities. The analyst does not know your particular objectives for returns or constraints upon investing. All investors are encouraged to do their own research before making any investment decision. Information is regularly obtained from Yahoo Finance, Google Finance, and SEC Database. If Yahoo, Google, or the SEC database contained faulty or old information it could be incorporated into my analysis.

A Compilation Of The Best International Equity ETFs

Summary I’m rounding up six of my favorite international equity ETF investments. I’m temporarily bearish on two of them for exposure to H-Shares in Hong Kong. I want international diversification without China. I like VNQI despite a high expense ratio because it is a fairly unique ETF for diversification. My favorite international ETF is SCHF due to the rock-bottom expense ratio. I’ve been holding off on purchases due to correlations on international investments. If China crashes, it may drag down most international investments. That could create an excellent buying opportunity on SCHF. Investors should be seeking at least some international exposure in their portfolio for diversification. To help with that challenge, I rounded up several of the ETFs that I believe offer some of the most compelling alternatives. These options have low expense ratios relative to the sectors they are covering and each is free to trade in at least one brokerage. Given the volatility of international equity markets, I consider a lack of trading costs to be a nice bonus for investors that may want to rebalance frequently. Since I want these assets to be solid targets for rebalancing, I also want strong liquidity so the bid-ask spread will be small. Below is a short list of contenders for the best international ETFs: Vanguard Global ex-U.S. Real Estate ETF (NASDAQ: VNQI ) Schwab International Equity ETF (NYSEARCA: SCHF ) Schwab Emerging Markets ETF (NYSEARCA: SCHE ) Schwab International Small-Cap Equity ETF (NYSEARCA: SCHC ) Vanguard FTSE Emerging Markets ETF (NYSEARCA: VWO ) Vanguard Total International Stock ETF (NASDAQ: VXUS ) While I like all of these ETFs for long-term returns due to low expense ratios, I feel some are more compelling than others at the present time. Different Exposure Diversified investments in global real estate are very rare. This is a niche sector, and I like the diversification benefits of including it in a portfolio. If the expense ratio was present on another ETF (.24%), I would find that expense ratio less attractive. However, for this niche market, it is a fairly low expense ratio. Another major factor for me right now is safety. I have been vocal about my bearish assessment of China and that means I prefer international equity with less exposure to China. Comparative Rankings for Emerging Markets In this list, which does not contain a single loser, I would personally put SCHE and VWO at the bottom because I’m not big on emerging markets right now. This is a temporary placement based on my assessment of which countries I want to include in my portfolio. China is being classified as an emerging market and has a heavy weight in these ETFs. That doesn’t mean that they are specifically holding the A-shares for Chinese equities, but I’m not big on the H-shares in Hong Kong either. I expect a crash in the Chinese market to result in dramatic losses of wealth for domestic consumers, and I see that loss of consumer wealth as causing a fundamental problem for sales in the country. Declining sales may drive declining earnings and that would justify lower valuations of the companies regardless of which market is being used to create exposure to businesses in China. If I were bullish on China, I would rank these two ETFs as being extremely attractive. Given my bearish stance, the combination of large positions in China and high correlation between emerging markets during times of stress (again, not the fault of the ETFs) makes me want to underweight emerging markets and severely underweight China. I favor trading shares of SCHE for free trading in a Schwab account. Investors with free trading on VWO should make the exact opposite argument. VNQI The market exposures are concerning me for VNQI, but holdings in China are fairly slow while still offering me a very unique portfolio. Since I want diversification and don’t want China, this is a natural choice for inclusion though I may be heavier on it than I really want to be. It is running around 13% to 14% of my portfolio. International Equity This section is looking at international equity that is not specified as emerging markets. These ETFs should hold more developed markets, and I expect them to be less volatile. I like all three of these ETFs (SCHF, SCHC, and VXUS) as solid options for international exposure, but the high correlation of emerging markets does not end with the other emerging markets. The emerging markets also have a fairly strong correlation to international equities when the markets are stressed. A terrible performance by China could hurt these ETFs because of the correlation even though they have solid holdings in markets that I consider to be more fundamentally sound. I don’t want to give up international equity exposure, and these are some of the best ETFs for gaining it. They all offer expense ratios below .20 and exposure to markets that I think are less risky than the emerging markets. I picked SCHF as my ETF to hold for a couple reasons. While the free trading is nice for making small additions, the ETF also delivers rock-bottom expense ratios for international ETFs. If I decide to make any additions to my international equity exposure, SCHF is the easy choice. SCHC offers some very interesting exposure elements with small-cap equity, but I’m concerned about market stress and correlations. Therefore, I figure small-cap international equity is more risky than large-cap international equity. Conclusion I find all six of the ETFs to be legitimate contenders for best of breed in their respective category. Due to expense ratios and a desire for more developed markets and larger companies, SCHF is the easy choice for my portfolio. The thing that makes me hesitate to buy more shares is not a concern about the fundamentals of the companies being overvalued; it is concerns about correlation to China hurting international returns. To conclude that though, if China crashes and correlation drags down share prices on SCHF, I’ll be one of the investors buying the cheap shares to take advantage of the situation. Disclosure: I am/we are long VNQI SCHF. (More…) I wrote this article myself, and it expresses my own opinions. I am not receiving compensation for it (other than from Seeking Alpha). I have no business relationship with any company whose stock is mentioned in this article. Additional disclosure: Information in this article represents the opinion of the analyst. All statements are represented as opinions, rather than facts, and should not be construed as advice to buy or sell a security. Ratings of “outperform” and “underperform” reflect the analyst’s estimation of a divergence between the market value for a security and the price that would be appropriate given the potential for risks and returns relative to other securities. The analyst does not know your particular objectives for returns or constraints upon investing. All investors are encouraged to do their own research before making any investment decision. Information is regularly obtained from Yahoo Finance, Google Finance, and SEC Database. If Yahoo, Google, or the SEC database contained faulty or old information it could be incorporated into my analysis.

The Low Volatility Anomaly: A Theoretical Underpinning

Summary This article introduces a discussion of the theoretical underpinning for the Low Volatility Anomaly, or why lower-risk investments have outperformed higher-risk investments over time. It features long time interval studies of the Low Volatility Anomaly from famed academics, supplementing the more recent 25-year study referenced in the introductory article to the series. The article discusses the divergence between model and market of one of the most oft-cited financial concepts. Given the long-run structural alpha generated by low volatility strategies, I want to dedicate a more detailed discussion of the efficacy of this style of investing for Seeking Alpha readers. Providing a detailed theoretical underpinning of the strategy or detailing multiple examples of its outperformance can prove challenging in a single blog post, so I am providing a more academic examination of the topic over multiple articles that each zero in on a separate proof point describing the strategy. In the first article in this series, I provided an introduction to the Low Volatility Anomaly with an example depicting the outperformance of a low-volatility (NYSEARCA: SPLV ) bent to the S&P 500 (NYSEARCA: SPY ) relative to the broader market and high-beta stocks. In this second article, I am going to begin to delve into a theoretical underpinning for the Low Volatility Anomaly and demonstrate that it has been proven in research dating back to the 1930s. Theoretical Underpinning for the Low Volatility Anomaly Since its introduction in the early 1960s, the Capital Asset Pricing Model (CAPM) has permeated the investment management landscape. CAPM is used to determine a theoretically appropriate required rate of return of an asset added to a diversified portfolio. This model takes into account the asset’s sensitivity to non-diversifiable risk, which is oft represented through the beta coefficient. In CAPM, in what has become one of the most fundamental formulas of modern finance, the expected return of an asset is equal to the risk-free rate plus the product of beta multiplied by the difference between the expected market return less the risk-free rate, as seen in the following equation: E(R a ) = R f + Β a *(E(R m )-R f ) The idea of beta is axiomatic to many investment managers. Investment discussion is littered with the concept of beta. High-beta investments have higher expected returns and above-market risk. As we move back down the security market line (SML), the inverse is then true for low-beta investments, characterized by lower expected returns and below-market risk. Empirical evidence, academic research and long time series studies across asset classes and geographies have shown that the actual relationship between risk and return is flatter than the model or market expectations suggests. At the extremes, and as shown in the graphs above in this article, the relationship between risk and return might indeed be negative. Understanding the shortcomings of CAPM and the market’s misinformed notion of the relationship between beta, risk and expected return could produce a normative arbitrage opportunity that is exceedingly capital-efficient. If the Capital Asset Pricing Model held in practice, we should see a linear relationship between beta and return as predicted by the model. Low-beta/lower-volatility assets would be expected to generate proportionately lower returns than the market. Since CAPM can be mathematically derived, and this series will subsequently demonstrate that it has failed in empirical tests, then the assumptions underpinning CAPM must be unable to hold in practice. Criticisms of the Capital Asset Pricing Model are almost as old as the model itself, but the model’s simplicity and utility have become ingrained in modern finance nonetheless. In 1972, Black, Scholes and Jensen, in a study of NYSE-listed stocks from 1931-1965, found that when securities were grouped into deciles by their beta, a time series regression of these portfolios’ excess returns on the market portfolio’s excess returns indicated that high-beta securities had significantly negative intercepts and that low-beta securities had significantly positive intercepts – a contradiction to the expected finding from the CAPM model. An excerpt of their findings is tabled below, expanding the scope of the Low Volatility Anomaly far longer than my simple twenty-five year charts. High-beta stocks (left) had negative alpha, and low-beta stocks (right) had positive alpha. (click to enlarge) Excerpted from “The Capital Asset Pricing Model: Some Empirical Tests” by Fischer Black, Michael Jensen and Myron Scholes (1972) Three years later, Robert Haugen and James Heins produced a forty-year study that demonstrated that, over the long run, stock portfolios with lower variance in monthly returns experienced greater average returns than riskier cohorts through multiple business cycles, and that relative returns were time series-dependent. Fischer Black (1993) and Robert Haugen (2012) would both produce academic papers decades later with expanded market data sets that demonstrated the efficacy of low volatility strategies. Black, enshrined in the nomenclature of an option pricing model that won his frequent collaborator Myron Scholes a Nobel Prize after Black’s death, updated his previous study conducted with Scholes and Jensen in 1972 to include data through 1991. A period that takes us from their early Depression-era study and links it with our S&P data from 1991 to current. (click to enlarge) Excerpted from “Beta and Return: Announcement of the Death of Beta Seem Premature”, Fischer Black 1993 In the chart above, one can see that in this expanded sample period, low-beta stocks (right) again did much better than predicted by CAPM (positive alpha), and high-beta stocks did worse still. Robert Haugen published several papers in the subsequent decades focused on the low volatility anomaly. In 1991, Haugen and collaborator Nardin Baker demonstrated that a low volatility subset of the capitalization-weighted Wilshire 5000 would have outperformed from 1972 to 1989. Shortly before Haugen’s death in early 2013, Baker and Haugen demonstrated that from 1990 through 2011, in a sample set that included stocks in twenty-one developed countries and twelve emerging markets, low-risk stocks outperformed in the total sample universe and in each individual country – a study I have previously referenced in past articles. Excerpted from: Low Risk Stocks Outperform within All Observable Markets of the World. Baker and Haugen (2012) If CAPM is a descriptive, but not practicable, model of investing, then violations of its underpinning assumptions could serve as possible explanations for successful strategies that appear to deviate from what one would expect from the model. The following pages are dedicated to examining how violations of CAPM’s assumptions lead to market returns that deviate from expectations. Sharpe (1964) formalized the assumptions underpinning Markowitz’s (1954) Modern Portfolio Theory . With the market fifty years later still thinking about risk-adjusted returns in a ratio bearing his name, it seems prudent to use Sharpe’s underlying model assumptions: Investors are rational and risk-averse, and when choosing among portfolios, they care only about maximizing economic utility of their one-period investment return; A common pure rate of interest, with all investors able to borrow or lend funds on equal terms; Homogeneous investor expectations, including expected values, standard deviations and correlation coefficients; The absence of taxes or transaction costs. The second of these underlying assumptions will form the basis of our first hypothesis, Leverage Aversion, for the existence and persistence of the Low Volatility Anomaly, which will be captured in the next article in this series. Disclaimer My articles may contain statements and projections that are forward-looking in nature, and therefore, inherently subject to numerous risks, uncertainties and assumptions. While my articles focus on generating long-term risk-adjusted returns, investment decisions necessarily involve the risk of loss of principal. Individual investor circumstances vary significantly, and information gleaned from my articles should be applied to your own unique investment situation, objectives, risk tolerance, and investment horizon. Disclosure: I am/we are long SPLV, SPY. (More…) I wrote this article myself, and it expresses my own opinions. I am not receiving compensation for it (other than from Seeking Alpha). I have no business relationship with any company whose stock is mentioned in this article.