Tag Archives: setpageviewname

Global X Serves Up A New Alternative ETF

By DailyAlts Staff Global X Funds has a growing line of “SuperDividend” ETFs, and the latest is sure to be of interest to liquid alts investors: the Global X SuperDividend Alternatives ETF (NASDAQ: ALTY ) , which began trading on the Nasdaq on July 14. The ETF is the sixth in Global X’s SuperDividend ETF series and is designed to closely track the INDXX SuperDividend Alternatives Index. The underlying index tracks the performance of the highest dividend-yielding securities in each category of alternative income investments, as defined by index sponsor INDXX. This includes MLPs (master limited partnerships), REITs (real estate investment trusts), BDCs (business development companies), and other nontraditional income-producing investments. The Global X SuperDividend Alternatives ETF’s aim is to provide income from alternative sources with low correlation to dividend stocks and other traditional income investments. The strategy also seeks to limit volatility by screening for lower-volatility investments and overweighting categories that have been less volatile, historically. “The alternatives space encompasses a broad range of investments with risks, returns and correlations that differ from traditional equity and fixed income securities,” said Jay Jacobs, research analyst at Global X Funds, in a recent statement. “Investors are increasingly looking for alternative solutions that can potentially generate high income while diversifying their portfolios. Applying the SuperDividend approach to the alternative income space is a natural extension of our suite.” In practice, the Global X SuperDividend Alternatives ETF carries exposure to MLPs and other infrastructure companies, REITs and other real estate investments, alternative managed portfolios, and fixed-income and derivative strategies. As of July 13, REITs accounted for the largest share of the fund’s holdings at over 26%, while private equity and BDCs accounted for the next-largest share at over 19%. MLPs constituted less than 9% of the fund’s holdings, according to the fund’s fact sheet . On the downside, the Global X SuperDividend Alternatives ETF’s expense ratio is rather high at 3.03%. This is largely a function of the fact that the fund invests in other funds, according to ETF.com , and, as required, includes the underlying expense ratios of those fund in its expense ratio.

Dividend Growth Stock Overview: SJW Corporation

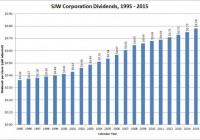
About SJW Corporation SJW Corporation (NYSE: SJW ) provides water services to customers in the San Jose, CA metropolitan area and to customers in the region between San Antonio and Austin, TX. The company was incorporated in California in February 1985, and is headquartered in San Jose. SJW has 395 full-time employees. The company is organized into four subsidiaries: (1) the San Jose Water Company; (2) SJWTX, Inc.; (3) SJW Land Company; and (4) the Texas Water Alliance. SJW Corporation does not report financial information for each of the subsidiaries separately. Originally incorporated in 1866, San Jose Water Company is the predecessor organization to SJW Corporation. In the 1985 reorganization, San Jose Water Company became a wholly-owned subsidiary of SJW Corporation. San Jose Water is a public utility that provides water service to over 1 million people in the metropolitan San Jose area. The company’s supply comes from a variety of sources, including groundwater, surface water, reclaimed water and imported water. Roughly 40-50% of its annual water production is purchased. SJWTX was incorporated in Texas in 1985, and does business as Canyon Lake Water Service Company. This subsidiary provides water service to roughly 36,000 people located in the region between San Antonio and Austin, TX. SJW Land Company owns undeveloped land in California and Tennessee, owns and operates commercial buildings in California, Arizona and Tennessee, and has a 70% interest in a real estate limited partnership. Finally, the Texas Water Alliance subsidiary is developing a water supply project in Texas to ensure future water supplies for the Canyon Lake Water Service Company. As a regulated utility, local and state authorities dictate SJW’s revenues and income. In 2014, the company had operating revenue of $320 million, which was up 15.5% from 2013. Net income more than doubled from 2013 to $51.8 million. Earnings per share did the same, coming in at $2.54, which gives the company a payout ratio of about 31% using the current annualized dividend of 78 cents per share. The revenue and income increase was due to approved rate changes, slightly offset by a reduction in customer water usage. The revenue increase continued in the 1st quarter of the year, with a 13.7% increase in revenue and a more than quadrupling of net income for the quarter year-over-year. In addition to the rate increases, the significant increase in net income was also due to a reduction of groundwater extraction costs. As a company that predominantly operates public utilities, SJW has had, and expects to have, large capital improvement expenditures. The company spent nearly $92 million on capital expenditures in 2014. In 2015, it plans to spend over $133 million as part of more than $660 million in capital improvements from 2015 to 2019. The company is a member of the Russell 2000 index and trades under the ticker symbol SJW. As of mid-July, the stock yielded 2.5%. SJW Corporation’s Dividend and Stock Split History (click to enlarge) SJW has grown dividends at less than 4% a year since 1995. SJW Corporation and its predecessor companies have paid dividends since 1944, and increased them since 1968. It announces annual dividend increases at the end of January, with the stock going ex-dividend in the first half of February. In January 2015, SJW announced a 4% dividend increase to an annualized rate of 78 cents per share. The company should announce its 49th consecutive annual dividend increase in January 2016. SJW Corp. historically increases its dividend in the low- to mid-single digit percentages, and the dividend growth rates reflect this. The company’s 5-year compounded annual dividend growth rate (CADGR) is 2.78%. Longer term, the CADGRs are slightly higher: the 10-year CADGR is 3.81%, the 20-year CADGR is 3.94% and the 25-year CADGR is 3.76%. SJW has split its stock twice. The splits occurred in close succession, with the company splitting the stock 3-for-1 in March 2004 and then 2-for-1 in March 2006. A single share purchased prior to March 2004 would have split into 6 shares. Over the 5 years ending December 31, 2014, SJW Corporation stock appreciated at an annualized rate of 10.40%, from a split-adjusted $19.35 to $31.73. This underperformed the 13.0% compounded return of the S&P 500 index and the 14.0% compounded return of the Russell 2000 Small Cap index over the same period. SJW Corporation’s Direct Purchase and Dividend Reinvestment Plans SJW does not have a direct purchase or dividend reinvestment plan. (The company initiated one for investors in 2011, but terminated it in 2014.) In order to invest in the stock, you’ll need to purchase it through a broker; most will allow you to reinvest dividends without any fee. Ask your broker for more information on how to set this up, if you are interested. Helpful Links SJW Corporation’s Investor Relations Website Current quote and financial summary for SJW Corporation (finviz.com) Disclosure: I do not currently have, nor do I plan to take positions in SJW.

Benjamin Graham’s Defensive Versus Enterprising Investor Performance Over The Dismal Decade Of 2000-2009

In a previous blog (see Benjamin Graham’s Value Investing versus the Robo-advisor ), I illustrated included a chart outlining the performance of the United States stock market over the course of every decade covering during the past 100 years. Stock performance over the past decade (2000-2009) was not only a net loser, including the paltry dividend income received, but it even underperformed the 1930’s depression era. If the typical investor had known this information at the start of the year 2000, I’m confident he or she would have remained on the sidelines in cash. Let’s assume that Mr. Market held a gun to your head, forcing you to buy and hold stocks over the coming decade. Further assume that you knew the performance in stocks would be terrible. Given few good options against the wrong end of Mr. Market’s gun, one might find some solace by turning to the value investing teachings of Benjamin Graham. How did value stocks perform over the dismal decade from 2000-2009? In Graham’s first edition of The Intelligent Investor , he outlined several approaches to stock selection. One approach was designed for the defensive investor, involving the selection of only stocks that met a conservative set of buying criteria with safety of principal as the primary concern. Another stock selection approach was designed for the more enterprising investor, one willing to assume more risk with the hope of gaining a larger profit. The defensive investor approach to stock selection recommends the following buying criteria: Benjamin Graham’s Stock Selection Rules for the Defensive Investor 1) Diversify your portfolio across at least 10 different securitie s, with a maximum of about 30. Over the decade from 2000-2009, we’ll review the range of portfolio returns for both a “10” and a “30” stock portfolio that met all of Graham’s criteria for the defensive investor. 2) Each company should be large, prominen t, and conservatively financed. We’ll put a company on the defensive investor list only if it had a market cap of at least $350 million. That’s about the size of a larger company in 1949 on an inflation-adjusted basis when Graham published The Intelligent Investor. Graham defined a company as “prominent” if it ranked in the upper-quarter to upper-third in size within a particular industry. We’ll give as many companies the benefit of the doubt as being “prominent” provided they were in the upper-third in size within a particular industry. A “conservatively financed” company according to Graham had total debt under half of its total market capitalization. We’ll screen out all stocks that are leveraged beyond this defensive-investor threshold. 3) Each company should have a long record of continuous dividend payments. The first edition of The Intelligent Investor was published in 1949. Graham was reluctant to exclude companies on the defensive list that discontinued their dividend payments during the 1931-1933 period. After all, that time period occurred shortly after the Dow Jones Industrial Average declined 85% in value, including the dividend income received. Graham must have felt that keeping stocks off of a defensive list simply because the dividend payments were temporarily discontinued during that awful time period was a bit restrictive. As a compromise, Graham allowed all companies to be on the defensive stock list provided that a continuous dividend payment took place on every stock back to the year 1936. That’s a historical 13-year dividend-paying history from the date of Graham’s book publication. We’ll follow a similar approach and require all stocks on our defensive list to have paid an uninterrupted dividend over the previous 13-year period. 4) The price paid for a stock should be reasonable in relation to its average earnings. Graham recommended purchasing only stocks that had a price-to-average-earnings ratio below 20. Average earnings was calculated using the previous five years of data from the income statement of each public company. We’ll follow the same approach and keep off of the defensive list any expensive stocks with a price-to-average-earnings ratio greater than 20. The charts below shows the performance of the best-and worst-performing stocks meeting Graham’s defensive stock criteria covering the worst-performing decade over the past century. The number of stocks at the start of the year 2000 that met all of Graham’s defensive selection criteria totaled 111. Ten Best – and Worst – Performing Defensive Stocks, Including Dividend Income… (click to enlarge) Thirty Best – and Worst – Performing Defensive Stocks, Including Dividend Income… (click to enlarge) As already mentioned, Graham recommended holding between 10 and 30 stocks that met the rigorous defensive stock criteria. As shown in the two charts above, quite a bit of variation in performance existed depending on what stocks were chosen from the defensive list. Diversifying across 30 defensive stocks instead of only 10 improved your worst-case portfolio return over the dismal decade, but it also reduced your potential best-case return. In general, following Graham’s value investing instruction of purchasing a number of defensive stocks stood a good chance of outperforming the broad stock market average over the course of the worst decade in history. Benjamin Graham’s Stock Selection Rules for the Enterprising Investor Graham outlined four broad categories available for the enterprising investor. 1) Buying in low markets and selling in high markets. 2) Buying carefully chosen “growth stocks” 3) Buying bargain issues of various types 4) Buying into “special situations” Choices one and two from the list are highly problematic to implement in real time. Many analysts on Wall Street have attempted to forecast the overall movement of the stock market or the future earnings of a particular company, with mixed results. Option four is a technical branch of investment, and according to Graham, “…only a small percentage of our enterprising investors are likely to engage in it.” We’ll put the microscope over choice number three on the list and look at the performance of buying only bargain issues over the past decade when stock returns scraped the bottom of the barrel. Graham’s bargain approach to stock selection involved either purchasing a stock that traded at a price below some multiple of estimated earnings or selecting securities priced below net current asset value . In a previous blog, we showed how difficult it was to estimate future earnings (see ” Does Earnings Growth Matter When it Comes to Stocks Trading below Liquidation Value? “). Given the challenges of forecasting company earnings, we’ll limit ourselves to only selecting stocks for the enterprising investor list that traded below net current asset value. Stocks that made it on to the enterprising investor list were purchased at a market price below 75% of net current asset value. No more than a 5% weighting was allocated to any one stock. If few stocks could be found meeting our rigorous value criterion, the balance of cash remained in U.S. Treasury Bills. The chart below compares the performance results of Graham’s enterprising investor approach to stock selection with the defensive approach over the dismal decade (2000-2009). Annual rebalancing took place once at the beginning of every yea r, and the capital gains taxes was assumed to be zero. Armed with the knowledge that equity performance over the previous decade (2000-2009) was horrible, you might think a defensive investor had the upper hand over an enterprising investor. In an environment hostile towards stock investing, one might assume that being as conservative as possible would be the better route to take. As illustrated in the chart below, the results are counterintuitive. (click to enlarge) Over the course of the dismal decade, bargain issues using the enterprising approach toward stock selection outperformed defensive stocks by a wide margin. Even if an investor managed to select the top-performing 10-30 stocks that met Graham’s defensive criteria, the portfolio still wouldn’t have outperformed a portfolio of stocks purchased below net current asset value. Negative-return years were more prevalent for the enterprising value investor, but not by much. Aggressive investors endured two negative-return years over the course of the dismal decade, while defensive investors endured only one. A chapter in the book, The Net Current Asset Value Approach to Stock Investing , reviewed the performance over the course of the dismal decade (2000-2009) using a maximum 10% portfolio weighting in any one net current asset value stock rather than the 5% weighting shown in the chart from above. Either way, the average annual return results are about the same and clobber the defensive approach to stock investing. Assuming an investor is willing to stomach greater monthly volatility, it pays to be aggressive even if the overall market provides few value investing opportunities as it did over the course of the period from 2000- 2009 .