Tag Archives: setpageviewname

A Comparison: Six Inverse Treasury Products

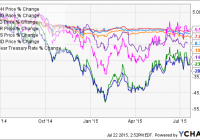
Summary With the possibility of an interest rate hike, investors should consider options for inverse leverage. I chose a basket of six comparable securities with varying degrees of inverse exposure to analyze. High yield bond and short treasury future combo ETFs are an interesting way to hedge against a potential rate hike. Introduction Recently, I’ve spent a considerable amount of time discussing how interest rates are going to rise. Investors should know how to capitalize on rising rates, so I’ve taken on the burden of analyzing every tool I can find that provides inverse exposure. If you want to learn more about rising rates , inverse hedging tools , and capitalizing on mentioned economic behavior, read the hyperlinked articles. Today, I will do a brief comp on six different tools that can be used for hedging against rates. Each of these ETFs and ETNs are fairly small (all under 200 Mil AUM), but for the individual investor looking for inverse exposure, they’re valid options that ought to be analyzed and considered. ETFs and ETNs for Inverse Treasury Coverage The six tools I will compare are: iShares Interest Rate Hedged High Yield Bond ETF (NYSEARCA: HYGH ), ProShares High Yield Interest Rate Hedged ETF (BATS: HYHG ), ProShares Investment Grade Interest Rate Hedged ETF (BATS: IGHG ), Barclays Inverse U.S. Treasury Aggregate ETN (NASDAQ: TAPR ), iPath U.S. Treasury 5-Year Bear ETN (NASDAQ: DFVS ), and PowerShares DB 3x Short 25+ Year Treasury Bond ETN (NYSEARCA: SBND ). HYGH HYHG IGHG TAPR DFVS SBND Average NAV 91.31 71.17 75.59 37.04 32.23 5.31 52.10833 Avg. Vol 7,143 19,191 17,655 4,080 4,282 59,285 18606 12-Mo Yield 5.85% 5.65% 3.52% 0% 0% 0% 2.503% Expense 0.55% 0.5% 0.3% 0.43% 0.75% 0.95% 0.58% Total Assets 105 135.22 166.3 24.45 3.94 42.52 79.57167 HYGH is a high-yield fund with positions in iShares iBoxx High Yield Corporate Bond ETF (NYSEARCA: HYG ) and short positions in Treasury futures. HYGH moves inversely to yields while providing high interest payments primarily through riskier bonds (avg. B rating). What HYGH lacks in volume, it makes up for in yields and exposure. Its 55 bps expense is fair. I would recommend HYGH for risk-taking investors seeking high interest payments and inverse exposure. For all intents and purposes, HYHG performs identically to HYGH. It is also a high-yielding bond ETF with built-in inverse exposure. I believe HYHG (yes, it’s confusing) is slightly better though because it holds a more diversified long portfolio, and it has more AUM. It also has a higher average bond quality (B+). Its expense ratio is lower as well (marginally) at 0.5%. HYHG is also more heavily traded on the market, which is beneficial to higher net worth investors. Finally, the last high-yield bond with inverse exposure is IGHG. IGHG has the most AUM; however, it has the lowest yields of the three. IGHG’s low yields are compensated by stronger underlying assets (average A – A- bond quality). DFVS, TAPR, and SBND are ETNs (with no income distributions) and expenses ranging from 0.58 bps to 0.95 bps that provide inverse exposure to Treasury yields. The benefit of an ETN is that it provides additional exposure, and the opportunity for higher returns (particularly in the short term). I believe there are better options on the market (like ProShares UltraShort 20+ Year Treasury ETF ( TBT), ProShares Short 20+ Year Treasury ETF (NYSEARCA: TBF ), and Direxion Daily 20+ Year Treasury Bear 3x Shares ETF (NYSEARCA: TMV ) for example). This article is for the sake of coverage and comparison. I will note that SBND resets monthly rather than daily. This monthly reset allows SBND to avoid some of the pitfalls inherent with tracking and compounding error . SBND is 3x leveraged, however, which comes with its own risks . Correlation To visually express correlation between these tools, and ten-year rates, I created a chart with each ETF/ETN. DFVS comes closest, though each security does generally follow the ups and downs of fluctuating rates. The Bond/Hedge combos are less volatile because they are composed of high-yield bonds (which don’t fluctuate as much) as well as Treasury futures. TAPR and SBND, because of time frame coverage and leverage, trade on a higher daily/monthly multiple than actual rates. However, in the long term, both TAPR and SBND will perform optimally over the other options if rate does trend upwards. SBND and TAPR should be avoided by the risk-averse investors. All mentioned securities show a desired level of correlation to Treasury rates. Conclusion HYGH, HYHG, and IGHG offer an interesting combination of income and inverse leverage. TAPR, DFVS, and SBND are pure ETNs that provide expected inverse exposure. The three ETNs are inferior to other options on the market in my opinion. The three Bond/Inverse combos, however, offer an interesting (potentially risky) avenue for long-term capitalization. Disclosure: I/we have no positions in any stocks mentioned, and no plans to initiate any positions within the next 72 hours. (More…) I wrote this article myself, and it expresses my own opinions. I am not receiving compensation for it (other than from Seeking Alpha). I have no business relationship with any company whose stock is mentioned in this article.

Does Your Portfolio Have A Margin Of Safety?

By Ronald Delegge Building an architecturally sound investment portfolio doesn’t happen by chance. A structurally strong and healthy portfolio is organized into three basic parts: 1) the portfolio’s core, 2) the portfolio’s non-core, and 3) the portfolio’s “margin of safety.” All portfolio parts complement each other by deliberating holding non-overlapping assets. Let’s talk about the part of the portfolio that represents the “margin of safety.” The concept “margin of safety” was originally developed in the 1930s by Benjamin Graham and David Dodd, the founders of value investing. Their idea was applied to selecting individual stocks at undervalued prices to help people become better investors. In the context of the individual investor, the “margin of safety” represents the capital or money that a person absolutely cannot afford to risk to potential market losses. Like an insurance premium, this money gets set aside from a person’s core and non-core portfolio to be invested in fixed accounts with principal protection and liquidity. (click to enlarge) Some people have deceived themselves into believing their investments require no margin of safety. This group generally believes they are too wealthy, too experienced, and too smart to have a margin of safety inside their portfolio. Ironically, this same group of people that invest without a margin of safety (or insurance), have insurance (or margin of safety) on their automobile, home, health, and life. Why is there an illogical disconnect between the need to protect physical assets, while simultaneously ignoring the financial ones? “I’m a long-term investor” or “the stock market always bounces back” are common excuses for investing without a margin of safety. Unfortunately, both of these techniques are not a credible form of portfolio risk management. Diligent and proper risk control is always proactive versus being passive or reactive. Others may claim that investing in bonds or physical assets like gold is their portfolio’s margin of safety. This too is erroneous. Why? Because bonds and precious metals are subject to daily fluctuations just like stocks and can lose market value. Gold’s almost 40% loss in value since mid-2011 is a tough lesson on why you shouldn’t use assets that are prone to market losses as a form of portfolio insurance. Similarly, those who have invested in long-term treasuries as a form of portfolio insurance have suffered losses near 8% over the past three-months alone! When is the best time to implement your portfolio’s margin of safety? Like insurance coverage, the prudent investor acquires a margin of safety within their investment portfolio before they need it. Put another way, the timing of when you implement your portfolio’s margin of safety is mission critical. Think about it this way: Would it be logical to attempt to buy insurance coverage after you’ve already had an automobile accident or after your home has been destroyed? Of course not! Similarly, would it be logical to implement a margin of safety after your portfolio has suffered catastrophic losses? Of course not! To be fully protected, you must prepare ahead. In summary, implementing your portfolio’s margin of safety should happen when market conditions are favorable, not when it’s raining cannonballs. And if you’re caught in the unfortunate situation where you failed to implement a margin of safety during good times and market conditions have deteriorated, the next most logical moment to implement your margin of safety is immediately. Disclosure: No positions Link to the original article on ETFguide.com

An Alternative Way To View Diversification

We’re living in a post 2008-2009 financial crisis world. Investors and advisors alike know that having your eggs all in one basket could land you in some hot water (especially if it’s the arguably broken 60/40 portfolio). The reason being, one single person or group isn’t able to call what’s going to be the “best” asset class (by performance only) in any given year. Enter the ever so popular diversification quilt , which essentially ranks each asset class top to bottom over the past 15 years. The issue, of course, is that although they include 10 asset classes, they really don’t include alternative investments, specifically Managed Futures. The latest to release a chart like this is Business Insider. As you might remember, we took the liberty of changing around the “quilts” published by Bloomberg back in September by adding Managed Futures to the mix. The second issue with the quilt table is that these “quilts” are all on the same axis level. For example, if an investment was the worst performer of the year and still up 2 or 3 percent, it would look the same as an investment that came in last at a -10% on a different year. Which got us thinking how different would the table look if we spread out the investments so that the performance range would be visible? This is what we got. P.S – Looking at each asset class on its own fluctuates year to year, is just one way to look at volatility. So, so we connected the dots of the largest performance range (Emerging Markets), Managed Futures, and the smallest performance range (Cash). (click to enlarge) (Past performance is not necessarily indicative of future results) Source: Large Cap = S&P 500 Small Cap = Russell 2000 Intl Stocks = MSCI EAFE Emerging Markets = MSCI Emerging Markets REIT = FTSE NAREIT All Equity Index HG Bond = Barclay’s U.S. Aggregate Bond Index HY Bond =BoAML US High Yield Master II Cash= 3 Month T Bill Rate AA = Asset Allocation Portfolio (15% Large Cap, 15% Intl Stocks, 10% Small Cap, 10% Emerging Markets, 10% REIT, 40% HG Bond Share this article with a colleague