Tag Archives: setpageviewname

It Is Not Possible That Valuations Matter Only At The Margins

By Rob Bennett You will often hear people say that valuations matter only at the margins. That is, valuations matter when prices are very high and when they are very low. Outside of that, it is okay to ignore the effect of valuations. I see this as dangerous thinking. My view is that either valuations matter or they do not. If they matter, they always matter. If they don’t matter, they never do. I am not able to make sense of the idea that valuations matter in some circumstances, but not in others. The first point that needs to be made is that there is a practical sense in which the claim that valuations only matter at the margins is true. Stocks generally offer a significantly better long-term value proposition than other asset classes. So, when stocks are priced at only a bit more than their fair value price, they remain a good investing choice. In a practical sense, then, a high stock allocation makes sense until the overvaluation reaches such a point that the mispricing is extreme. The problem is that there is no one valuation level at which stocks are transformed from a good choice to a bad one. Stocks are a little less appealing when the P/E10 level is 18 than they are when the P/E10 level is 15. And they are, of course, even less appealing when the P/E10 level is 21. And then even less appealing when the P/E10 level is 24. And even less appealing when the P/E10 level is 27. What is the investor to do? When does he lower his stock allocation, and by how much? It’s tricky. Stocks became a bit less appealing when the P/E10 level rose from 15 to 18, and then again when it moved from 18 to 21, and from 21 to 24, and from 24 to 27. But as the PE10 level moved from 15 to 27, the feedback being received by the investor was all positive. The risk of owning stocks was becoming greater. The investor should have been lowering his stock allocation in an effort to keep his risk profile constant. But at the moment when the P/E10 value reached the insane level of 27, the investor who failed to lower his stock allocation as the P/E10 value moved to 18, and then to 21, and then to 24, and then to 27 was feeling good about those decisions. So he was left disinclined to changing it much, even when prices had gone to “the margins” of 27 and above. What Jack Bogle says about this is that investors should not change their stock allocations in response to price increases. But if they feel that they absolutely must change their allocation at the margins, they should not lower them by more than 15 percent. Bogle has never explained how he came up with the 15 percent figure. I use the historical return data as my guide. The data shows that stocks are likely to offer an amazing long-term return when prices are at low levels or at fair value levels, and then the long-term return drops and drops as prices continue to rise. The data shows that most investors should have been going with a stock allocation of about 80 percent in the early 1990s and about 20 percent in the late 1990s and early 2000s. That’s a change not of 15 percentage points, but of 60 percentage points. Bogle’s recommendation is off by 400 percent, according to the 145 years of historical data available to us today. How many people know that? People don’t know how dangerous it is to own stocks when they are selling at high valuation levels, because most advisors buy into the idea that valuations matter only at the margins. If you only consider valuations at the margins, you are missing out on most of the story of how the mispricing of stocks derails investor retirement plans. Stocks don’t suddenly become dangerous when the P/E10 value hits 27. They are virtually risk-free when the P/E10 value is 15. Then, they become more risky at 18. And more risky at 21. And more risky at 24. And more risky at 27. Unfortunately, the growing risk is a silent one. Stocks are far more risky when the P/E10 value is 21 than they are when it is 15. But years can go by before that risk evidences itself in portfolio destruction. Valuation risk plays out the way that cancer risk plays out for people who smoke three packs of cigarettes each day. Heavy smokers often “get away” with their behavior for decades before they contract a disease that kills them. However, the deep reality is different from the surface one. Someone who smokes three packs of cigarettes each day from age 16 to age 66 and then dies at age 67 from lung cancer was not avoiding the risk of smoking for 50 years; he was avoiding only the practical consequences of taking on a risk that would one day cause him to pay a terrible price. Disclosure: None.
Using ETFs To Short The Market

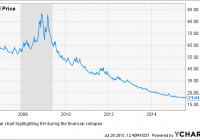
Summary The structure and pricing of inverse and leveraged ETPs is complicated. The principal investments of this fund are money market instruments and derivatives. Daily re-balancing can be a concern. Reading through recent Seeking Alpha articles regarding the broader market, lengthy and often heated discussions tend to develop on the direction of the market. That being said, it seems as if opinions on the eventual breakthrough of the current sideways trading range are about half and half, with maybe slightly more bulls. I also recently read comments on an article about leveraged and inverse exchange-traded products, where many readers did not seem to have a clear understanding of how (particularly) inverse ETPs are priced. In light of these two observations, I thought it pertinent to analyze how an inverse ETF is structured, for the benefit of investors who are considering investing in one in order to profit from potential downside movement. Due to the referenced uncertainty and volatility present in the overall market, I decided to use the ProShares Short S&P 500 ETF (NYSEARCA: SH ) as the subject matter for my analysis. SH is an inverse ETF that attempts to return -1x the return of the S&P 500 on a daily basis. How does it achieve inverse returns? SH achieves returns that are inversely correlated to the S&P 500 by investing in assets and derivatives that perform (or historically perform) well when the market is not performing well. There are four main investments used by ProShares in its inverse index ETFs, and these are: Swaps (derivative market) Futures (derivative market) U.S. Treasury Bills (money market) Repurchase Agreements (money market) Derivatives : The sale of swaps will benefit in a falling market, because the buyer of the swaps is required to pay the seller the amount that the underlying has fallen in price. Inverse exposure through futures is likely most often achieved by short-selling index futures. Money Market Instruments : The use of short-term Treasuries and other money market instruments relates to the fact that short-term debt historically performs inversely to the market. This is due to there being a “flight to safety” when the equity markets are falling. Daily Re-balancing: For periods longer than a single day, the Fund will lose money when the level of the Index is flat, and it is possible that the Fund will lose money even if the level of the Index falls. – SH Prospectus The effect of daily rebalancing is one of the primary misunderstandings regarding inverse or leveraged ETFs that I see on Seeking Alpha. People discuss how they will “invest” in a leveraged ETF and hold it for several weeks, months, or even years in some instances. It is important to recognize that this is not the intended purpose of this type of ETF. These are intended to be traded for short time periods. In order to maintain the proper leverage ratio, inverse returns, and index exposure, SH is rebalanced each day. What this means for an investor is simple to illustrate: Suppose that at the end of the trading day on Monday, you invest $1,000 in a -1x inverse ETF @ $100 per share. The ETF tracks an underlying index with a value of $5,000. At market close on Tuesday, the index has decreased 10% to $4,500. In turn, the ETF has risen 10% to $110. By the close on Wednesday, the index has recovered to the original $5,000 – a roughly 11.11% gain. In turn, the ETF now loses 11.11%, which brings the value of your position to $97.78. Even though the index is exactly the same value as it was when you initiated the position, your position has lost money. This effect is also known as beta slippage. Note: This could theoretically work to your advantage, should the opposite situation occur. Conclusion: Simply by looking at a chart of SH, you will see that if you had held it for the duration of the 2008 collapse, you would have indeed profited: ND data by YCharts However, the return ratio was not accurate, with SH gaining approximately 26.07% from 1st January, 2007 to the first peak and SPX losing approximately 43.25% in the same time frame. In short, an inverse ETF like SH can be a great way to hedge short-term volatility or for intra-day trading, but if an investor is looking to actually short an asset (in this case, the S&P 500) for a long-term position, then it is not the most effective way to do so. Hopefully, with a clearer understanding of how this ETF is structured, prospective investors can make better use of it as a tool for his or her portfolio. Disclosure: I/we have no positions in any stocks mentioned, and no plans to initiate any positions within the next 72 hours. (More…) I wrote this article myself, and it expresses my own opinions. I am not receiving compensation for it (other than from Seeking Alpha). I have no business relationship with any company whose stock is mentioned in this article. Additional disclosure: This article is not intended to offer a recommendation to buy or sell any particular asset, and does not reflect the author’s opinions on the direction of the market. It is simply intended to provide an overview of how a complicated but useful financial instrument works.

Remember July 2011? The Stock Market’s Advance-Decline (A/D) Line Remembers

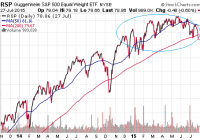
Paying a premium for growth is one thing. Chasing a handful of momentum stocks is another. Six corporations account for more than the entirety of the meager 2015 gains in the S&P 500. What happens when one examines the S&P 500 on an equal-weighted basis? Clearly, there is a dichotomy between the health of the overall stock market and the relatively high price of the popular benchmarks. According to Bloomberg data, the modest year-to-date increase in the S&P 500 is attributable to health care and retail alone. Worse yet, the two industry segments trade at a 20% premium to the market at large. Paying a premium for growth is one thing. Chasing a handful of momentum stocks is another. Brokerage firm Jones Trading sharpened the knife even further, noting that six corporations account for more than the entirety of the meager 2015 gains in the S&P 500. Those companies? Amazon (NASDAQ: AMZN ), Apple (NASDAQ: AAPL ), Facebook (NASDAQ: FB ), Gilead (NASDAQ: GILD ), Google (NASDAQ: GOOG ) and Walt Disney Co (NYSE: DIS ). The narrowing of the market itself coupled with the types of businesses on the list (with the possible exception of Walt Disney) strongly resembles late 1990s euphoria . What happens when one examines the S&P 500 on an equal-weighted basis? We find that that stocks have been stuck in one of the tightest trading ranges in market history for as long as the Federal Reserve ended quantitative easing (“QE3″). Here is the performance of the Guggenheim S&P Equal Weight ETF (NYSEARCA: RSP ) since QE3 wrapped up at the end of October in 2014. The ongoing deterioration in the S&P 500’s Bullish Percentage Index (BPI) underscores the challenges that investors face. Do they chase the Googles and the Gileads? Do they look for value in the energy patch through acquiring beaten down exchange-traded proxies like the Energy Select Sector SPDR ETF (NYSEARCA: XLE )? Or do they recognize that 50% of the S&P 500 components are currently in downtrends – a demarcation that is unfavorable for the long-term sustainability of the 3rd longest bull in history. Clearly, there is a dichotomy between the health of the overall stock market and the relatively high price of the popular benchmarks. Addressing the internal components of major benchmarks like the S&P 500, Dow Jones Industrials, NYSE Composite or NASDAQ as they relate to the handful of momentum leaders in those benchmarks leaves one to ponder what will happen next. Will the weight of the overall market crush the Atlas-like performance of health and retail? On the flip side, is it possible that underachieving sectors like industrials, materials, energy, utilities, transports and telecom might join the winner’s circle? Unfortunately, history suggests that overvalued sectors tend to crumble and join the beleaguered areas, as opposed to the troubled spots catching a bid first. Indeed, the last time that the New York Stock Exchange’s Advance Decline Line (A/D) Line fell below a 200-day moving average, the broader S&P 500 fell more than 19%. It occurred in July of 2011 as the euro-zone crisis had been spiraling out of control. For those that believe the illusion of economic acceleration could help the cause, media spin and double seasonally adjusted GDP reporting will not help. The reality of a lusterless U.S. economy is far too great. The manufacturing, mining, and utilities that collectively comprise the industrial sector recently registered its weakest year-over-year growth in a half-decade. Wholesale sales have dropped steadily over the past four years. Exporting on a strong dollar has been difficult for those multi-nationals that operate in Asia and Europe. Wage growth has been stuck in and around 2% since the end of the Great Recession in 2009. The workforce participation rate – a measure of actual employment – is as poor as it had been in the recession-weary late 70s. And homeownership at 63.4% is the lowest that it has been since 1967. What about the consumer? Aren’t people feeling wealthier? I suppose this depends upon the people you ask. The Conference Board’s U.S. Consumer Confidence was about as discouraging a data point as anyone has seen lately. Consumer expectations plummeted from 92.8 to 79.9 – the lowest reading since February 2014. And Gallup’s reading last week wasn’t much better; that is, for whatever reason, Americans believe the economy is getting worse. As long as the Federal Reserve maintains its plan to raise the cost of borrowing, and as long as the U.S. dollar rises alongside those expectations, the broader market is likely to remain range-bound. You’d have to hold the horses that have been winning, like the iShares S&P 100 ETF (NYSEARCA: OEF ) and the Health Care Select Sect SPDR ETF (NYSEARCA: XLV ). Yet you wouldn’t necessarily want to add to your overall equity position. You might also want to avoid areas of the market that are weakening in the face of higher borrowing costs and a higher greenback. The Industrial Select Sector SPDR ETF (NYSEARCA: XLI ) have gone nowhere in the nine months since QE3 officially ended. Click here for Gary’s latest podcast. Disclosure: Gary Gordon, MS, CFP is the president of Pacific Park Financial, Inc., a Registered Investment Adviser with the SEC. Gary Gordon, Pacific Park Financial, Inc, and/or its clients may hold positions in the ETFs, mutual funds, and/or any investment asset mentioned above. The commentary does not constitute individualized investment advice. The opinions offered herein are not personalized recommendations to buy, sell or hold securities. At times, issuers of exchange-traded products compensate Pacific Park Financial, Inc. or its subsidiaries for advertising at the ETF Expert web site. ETF Expert content is created independently of any advertising relationships.